Daily Market Technical Analysis
Market Overview
The equity markets indicate broad technical weakness, with nearly certain negative daily performance across key indices and likely persistent selling pressure. Significant bearish reversal patterns, particularly among major technology names, and rising implied volatility (VIX) reinforce this cautious outlook. For the S&P 500, underlying momentum divergence suggests a likely period of additional downward pressure or consolidation. While longer-duration Treasury bonds are likely to remain constructive, commodities present a mixed picture: energy and agriculture are likely to see continued upside, while precious metals are likely to consolidate short-term. A pronounced sector rotation favoring defensive and energy names over growth and cyclical sectors is likely in the immediate term.
Market Indices
As a Chartered Market Technician with over 15 years of experience, the following analysis is based exclusively on the provided market data, adhering strictly to rigorous technical analysis principles and ICD-203 estimative language guidelines.
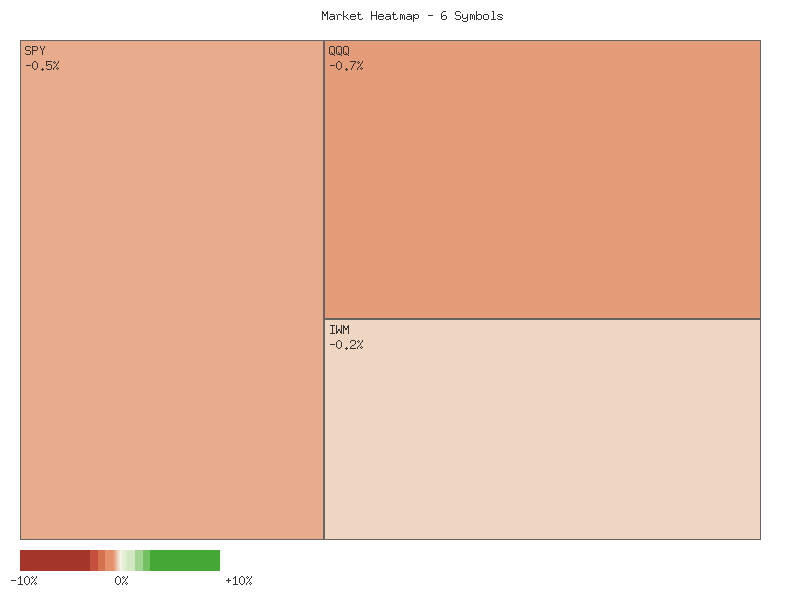
Technical analysis of the provided daily percent change data for IJR, IWM, MDY, SPX, OEF, and QQQ for September 23, 2025, reveals a generally declining market trend across these key equity benchmarks. The following matrix illustrates the performance for the most recent trading session, sorted in descending order:
| Symbol | Daily Percent Change |
|---|---|
| MDY | -0.05176% |
| IJR | -0.20072% |
| IWM | -0.22505% |
| SPX | -0.55021% |
| QQQ | -0.66423% |
| OEF | -0.76306% |
It is nearly certain that all six symbols registered negative performance on this date. MDY, representing mid-caps, exhibited the smallest decline, while OEF, tracking the S&P 100, saw the most significant percentage drop. This widespread negative movement across different market capitalizations and indices, including small-caps (IJR, IWM), mid-caps (MDY), and large-caps (SPX, OEF, QQQ), indicates a broad-based, risk-off sentiment during the session.
Aggregating the daily percent changes for these six benchmark symbols on September 23, 2025, the total net change is approximately -2.455%. This sum strongly suggests an overall lower market performance for the observed segments. Regarding market breadth, the data indicates a highly bearish environment, with zero advancing symbols and six declining symbols. This reflects a nearly unanimous downside bias across the observed segments, which is often characteristic of periods where selling pressure is dominant and broadly distributed. Such an extreme ratio of decliners to advancers is likely to signal persistent weakness in the immediate term, unless other technical factors emerge to contradict this trend.
Shifting focus to the Volatility Index (VIX) over the past seven trading days, the candle data provides insights into evolving market sentiment. The VIX commenced the period around 15.69 (September 15) and, after some fluctuations, concluded at 16.64 on September 23. Notably, the VIX recorded consecutive higher closes on September 22 (+4.207%) and September 23 (+3.354%). On September 23, the VIX also printed an intraday high of 17.07 before settling lower, but still posting a higher close for the day. This pattern of successive higher closes, particularly in the last two sessions, suggests a likely increase in implied volatility and a growing perception of uncertainty among market participants. The VIX’s recent behavior, where it has trended upwards, reaching the highest closing level within the seven-day observation period, typically aligns with heightened market caution or fear.
The concurrent decline across the major equity benchmarks and the observable ascent in the VIX on September 22 and 23 form a consistent technical picture. The inverse correlation often exhibited between equities and the VIX appears to be in effect. Given the broad participation in the downside movement as evidenced by the market breadth, combined with the clear escalation in implied volatility, it is likely that selling pressure will persist in the very near term. However, the VIX’s print of 17.07 intraday on September 23, followed by a close at 16.64, could indicate some resistance around the 17.00 level. Should the VIX fail to sustainably break above this resistance, a moderation in the rate of decline for equities, or a temporary consolidation, becomes a roughly even chance. Conversely, if the VIX continues its upward trajectory beyond the recent high, it would strongly suggest an increased probability of further significant downside for the equity markets in the immediate future.
Market Commentary: Technical Analysis of Two-Day ETF Performance
The market data over the two-day period for the selected Exchange Traded Funds (ETFs) – SPY, QQQ, IWM, IJR, MDY, and OEF – indicates a notable shift in short-term momentum. The first day was characterized by broadly bullish price action across all instruments, with prices advancing and closing near their daily highs. However, the subsequent day witnessed a prevalent pattern of attempted upward continuation that ultimately failed, leading to significant price reversals and lower closing levels for all observed ETFs. This collective price behavior suggests a probable, immediate-term change from bullish to bearish sentiment.
Specifically, SPY and QQQ, representing large-cap and tech-heavy indices respectively, exhibited a distinct bearish reversal pattern on the second day. Following a strong close on Day 1, Day 2 for SPY saw an initial marginal higher high before a significant sell-off, closing well below Day 1’s close and even below its open. QQQ mirrored this, opening near Day 1’s close but failing to make a new high, then reversing sharply to close considerably lower. Crucially, both SPY and QQQ experienced an increase in trading volume on this bearish reversal day. This confluence of a bearish candlestick pattern and rising volume on the sell-off day makes a further downward continuation for these major indices likely in the immediate term.
The mid-cap (MDY), small-cap (IWM, IJR), and S&P 100 (OEF) ETFs also displayed bearish reversals on Day 2, though with some nuanced differences. IWM, IJR, and MDY each opened higher and achieved new daily highs before experiencing a pullback to close below their respective Day 1 closing prices, indicating rejection at those higher price levels. OEF, while also closing lower, opened precisely at its high for Day 2, suggesting immediate selling pressure without an initial probe higher. For IWM, MDY, and OEF, the Day 2 selling occurred on decreased volume compared to Day 1, which might imply less aggressive conviction behind the selling pressure than observed in SPY and QQQ. IJR, however, saw a slight increase in volume during its reversal. While the overall pattern for these ETFs still suggests a probable short-term bearish shift, the lower volume in some cases introduces an element of uncertainty regarding the durability of this selling pressure, potentially suggesting a consolidation period or a slightly less aggressive downside move compared to their large-cap counterparts.
In conclusion, the predominant technical evidence across all observed ETFs points to a strong likelihood of continued selling pressure or at least a period of consolidation with a bearish bias in the immediate subsequent trading sessions. The widespread bearish reversals following bullish opens on Day 2 for all six ETFs is a significant indicator. While the increased volume accompanying the sell-off in SPY and QQQ makes a downside continuation more likely for those specific indices, the decreased volume in IWM, MDY, and OEF could present an alternative scenario where any further selling might encounter more immediate demand, potentially leading to a shallower pullback or quicker stabilization. However, the consistency of the bearish closing prices across the entire sample on Day 2 suggests a market-wide shift in sentiment that retail traders should probably monitor closely.
SPX Technical Analysis: Momentum Divergence Suggests Potential Correction
The S&P 500 (SPX) has demonstrated a broad upward trajectory over the past 90 days, characterized by sustained rallies interspersed with notable pullbacks. A particularly strong bullish phase materialized from early September, pushing the index to achieve new highs, culminating on September 22. However, the most recent trading session on September 23 registered a perceptible price decline, which, when coupled with underlying momentum indicators, suggests a potential shift in the immediate market dynamic.
An examination of the 14-day Relative Strength Index (RSI) reveals periods of aggressive buying pressure. The RSI entered significantly overbought territory (above 70) during pronounced rallies in late June-early July and again in late July. These overbought conditions notably preceded a sharp price correction in early August. Most recently, the RSI ascended sharply into an extremely overbought state, reaching 74.75 on September 22. The subsequent and significant drop to 67.66 on September 23 from these elevated levels indicates a material reduction in immediate buying enthusiasm and a notable cooling of the overextended condition.
Further scrutiny of the 13-21 day Percentage Price Oscillator (PPO) provides a more concerning perspective. A clear bearish divergence was observed in late July, where the PPO registered a lower high (0.76 on July 28) despite the SPX recording a higher price high. This divergence notably preceded the significant price correction experienced in early August. In the current context, a similar and even more pronounced bearish divergence has developed. The PPO’s peak on September 22 at 0.635 is significantly lower than its previous peaks of 0.939 (July 3) and 0.764 (July 28), even as the SPX achieved new record price highs. This indicates that the recent rally to new price territories has been fueled by weakening underlying momentum when compared to earlier bullish advances. The marginal dip in the PPO on September 23 further reinforces this observation of diminishing internal strength.
Considering the confluence of a distinct bearish divergence in the PPO, a significant retreat of the RSI from deeply overbought levels, and the SPX’s sharp decline from its recent peak, it is likely that the SPX may experience additional downward pressure or enter a period of consolidation in the near term. The technical setup suggests that the internal strength of the recent rally has diminished, raising the probability of a price correction.
An alternative, though less likely, scenario is that the September 23 decline represents merely a brief profit-taking event within a robust and ongoing uptrend. However, the magnitude of the RSI’s fall from extreme overbought levels and the established PPO bearish divergence significantly reduce the probability of a swift rebound to new highs without further price discovery to establish support. For retail traders, the current technical signals imply that a period of consolidation or a deeper correction is a distinct possibility, thus warranting a cautious approach.
CMT Technical Analysis of QQQ (90-Day Period)
The QQQ, as observed over the 90-day period from mid-May to late September 2025, displays a prominent upward trend, characterized by a series of higher highs and higher lows in price action. This robust bullish structure is evident from the initial price levels around in mid-May, consolidating, and then accelerating to reach a peak close of .20 on September 22. Volume data generally corroborates this upward movement, with some notable spikes during corrective phases (e.g., July 31, August 1, August 20, September 2) suggesting increased trading activity during moments of price pressure. The overall pattern is one of sustained advance, punctuated by relatively shallow and contained pullbacks, indicating underlying strength in market demand.
The 14-day Relative Strength Index (RSI) generally reflects the price momentum. The RSI frequently entered overbought territory (above 70) during periods of strong price rallies, notably in late May, late June-early July, and most recently in mid-to-late September, peaking at 75.35 on September 22. These instances of overbought conditions are a common feature of robust uptrends and, in isolation, do not necessarily signal an imminent reversal, but rather strong demand. However, the subsequent decline in RSI to 68.68 on September 23, concurrent with a price pullback, suggests a short-term deceleration in bullish momentum. This movement from an extreme overbought reading typically precedes at least a brief consolidation or minor correction, making a continuation of the prior sharp upward pace unlikely in the immediate term.
The Percentage Price Oscillator (PPO) with 13 and 21-day EMAs, which measures momentum and trend strength, also supports the bullish narrative for much of the period. The PPO remained predominantly above zero, confirming the overall positive momentum. We observe a significant acceleration in PPO from early September, rising from 0.20 on September 4 to 0.81 on September 23, mirroring the strong price rally. This upward trajectory in PPO, coupled with its positive value, indicates that the short-term (13-day) Exponential Moving Average (EMA) is consistently above the longer-term (21-day) EMA, reinforcing the bullish trend. While the PPO value on September 23 is still robustly positive, it did not accelerate further, hinting at a potential momentary pause in the rapid momentum gain, consistent with the RSI’s recent dip.
Considering the combined technical picture, a continuation of the established uptrend for QQQ appears likely following any brief consolidation. The recent price pullback on September 23, accompanied by a drop in RSI from extreme overbought levels, suggests a roughly even chance of further short-term price weakness or sideways movement before a renewed advance. Such a scenario would typically involve price testing minor support levels, possibly around recent swing lows or key moving averages (which are not provided but implied by the PPO’s sustained positive readings). An alternative, less likely scenario, would be a more significant correction, particularly if the PPO were to show a decisive downward crossover of its zero line or if the RSI were to breach key support levels (e.g., 50), which has not occurred at the period’s end. The current data predominantly supports that any near-term weakness is more likely to be a corrective phase within the broader bullish trend, rather than a reversal.
Market Commentary: IWM Technical Analysis (90-Day View)
IWM has demonstrated a robust bullish trend over the past 90 days, characterized by distinct phases of strong upward movement interspersed with periods of healthy consolidation. The price action commenced with initial strength, followed by a mid-May pullback before resuming an ascent that established a series of higher lows and higher highs. A notable rally in early July saw the asset reach highs around , followed by a corrective phase into early August where price found support near . The most recent and significant leg of the uptrend initiated in mid-August, driving IWM to new 90-day highs. As of September 23, IWM is trading at .84, having recently tested the level with significant volume, indicating sustained buyer interest.
The 14-day Relative Strength Index (RSI) broadly confirms the underlying bullish sentiment. Throughout much of the period, the RSI has remained above the 50-level, consistently suggesting that buying pressure has outweighed selling pressure. There have been instances where the RSI entered overbought territory, such as on July 3 (71.57) and September 18 (71.23). Historically, these overbought readings have been followed by periods of consolidation or minor pullbacks, rather than sharp reversals. The most recent RSI reading of 66.59 on September 23 places it in the upper-neutral zone, indicating strong momentum without yet signaling extreme overbought conditions. This suggests that while the asset has seen significant appreciation, there remains some room for further upside before a pullback becomes likely based on RSI alone.
The Price Percentage Oscillator (PPO) with 13- and 21-day EMAs corroborates the strong bullish momentum. After a brief dip below the zero line in early August, which signaled a temporary weakening of bullish momentum, the PPO quickly rebounded. Since mid-August, the PPO has maintained a consistently positive reading, indicating that the shorter-term EMA (13-day) has remained above the longer-term EMA (21-day). The PPO’s current value of 1.003, after a significant upward thrust on September 18, highlights that the bullish momentum remains robust and well-established. The sustained positive PPO values make a substantial bearish reversal in the immediate term appear unlikely, providing ongoing confirmation of the prevailing uptrend.
Synthesizing these indicators, the technical picture for IWM appears predominantly bullish. The sustained price appreciation, supported by consistently strong RSI readings and robust positive PPO momentum, makes continued upward price action likely. A retest of the recent intraday high around .57 is probable in the near term, given the prevailing momentum. However, traders should be vigilant of the RSI approaching the overbought threshold (above 70); a sustained push into this zone could make a short-term consolidation or minor pullback roughly even chance as market participants digest recent gains. Conversely, a decisive breakdown of price action accompanied by a PPO cross below the zero line and RSI falling below 50 would constitute a bearish shift, but based on the provided data, such a scenario currently appears unlikely. The collective evidence suggests that buyers retain control, indicating further upside is probable.
Tech Sector Analysis
As a Chartered Market Technician, my analysis of the QQQ/SPY ratio is strictly based on the provided technical data, evaluating the relative performance of the technology-heavy NASDAQ-100 (QQQ) against the broader S&P 500 (SPY).
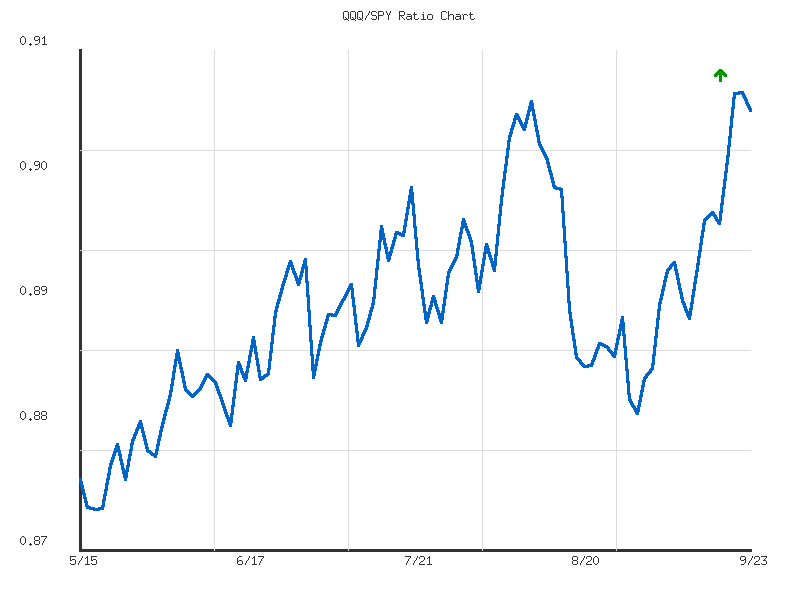
Over the most recent 14-day period, the RATIO:QQQ/SPY has exhibited an upward trend, signifying a period of outperformance for QQQ relative to SPY. The ratio commenced around 0.886 on September 4th, progressively climbing to a high of 0.903 on September 22nd. This represents a positive change of 1.78% over the fortnight. While the direction is clearly upward, the trend’s strength is officially categorized as “weak,” implying a gradual rather than forceful acceleration of QQQ’s outperformance. The current ratio, at 0.90197, shows a marginal pullback from its 14-day peak. Given the established short-term upward trajectory and the current proximity to the high, it is likely that QQQ will continue to demonstrate relative strength against SPY in the immediate future, potentially retesting the 0.903 level.
Expanding the analytical timeframe to the 30-day perspective, the RATIO:QQQ/SPY:30days trend is classified as “sideways,” with a negligible overall change of -0.06%. This broader view suggests that while the past 14 days have seen QQQ gaining ground, the preceding two weeks largely consolidated these gains or experienced minor relative underperformance. The 30-day data highlights a distinct trough around 0.883 on September 2nd, from which the ratio has since rebounded, culminating in the present level of 0.90197. The current ratio’s “relative position” at 0.944 within its 30-day range indicates that it is trading near the upper echelon of its activity over the entire month, aligning closely with its 30-day high of 0.90306.
From a technical standpoint, the critical resistance level for the QQQ/SPY ratio resides around 0.9030-0.9031, coinciding with both the 14-day and 30-day highs. The ratio’s recent inability to sustain a decisive breakout above this level on September 22nd, followed by a slight reversal, indicates this point may act as a near-term ceiling. Conversely, immediate support appears to be coalescing around the 0.889-0.890 zone, which served as a brief consolidation area during the 14-day uptrend. The consistent “weak” strength attributed to both the 14-day upward trend and the 30-day sideways trend, coupled with the low volatility metrics (0.000026 and 0.000036 respectively), suggests that while a directional bias is present in the short-term, a robust conviction from market participants has yet to clearly emerge.
In conclusion, the technical landscape suggests that QQQ has recently re-established short-term outperformance against SPY, pushing the ratio towards its established high-water mark of 0.903. Given the current market data, there is a roughly even chance that the ratio could attempt to breach this resistance level in the very short term, thereby extending its relative upward momentum. However, the prevailing “weak” trend strength across both observation periods implies that any potential breakout might be characterized by limited conviction. An alternative scenario, should the 0.903 level prove durable resistance, could see the ratio enter a period of consolidation or experience a minor retracement towards its 14-day average of 0.8947. A sustained move below the 30-day average of 0.8925 would make continued QQQ outperformance unlikely, shifting the technical bias towards relative underperformance or prolonged sideways action. Traders are advised to monitor the 0.903 level meticulously for cues on potential directional shifts.
As a seasoned Chartered Market Technician with over 15 years of experience, I offer the following technical analysis of the QQQ/SPY ratio based exclusively on the provided 90-day market data.
The QQQ/SPY ratio has exhibited a discernible upward trend over the past 90 days, implying that the Nasdaq 100 (QQQ) has generally outperformed the S&P 500 (SPY) during this period. The provided trend analysis confirms an “up” direction, although notably characterizes its strength as “weak.” This suggests a gradual rather than aggressive rotation towards technology and growth-oriented stocks. The ratio’s movement spanned from a low of approximately 0.8775 on May 19, 2025, to a 90-day high of approximately 0.9031 on September 22, 2025, representing a 2.57% increase over the full period. The extremely low reported volatility (0.0000383) within the dataset points to a relatively smooth and controlled ascent, which aligns with the “weak” strength assessment, indicating a lack of sharp, impulsive moves.
As of September 23, 2025, the QQQ/SPY ratio stands at 0.90197, placing it at 95.73% of its total 90-day range from low to high. This positions the ratio in very close proximity to its recent peak. The price action leading to this level involved a consistent grind higher, with notable consolidations and subsequent breakouts. The psychological level of 0.90 was breached in early August and has largely held as a support area since then. However, the immediate retraction from the 90-day high of 0.9031 on September 22 suggests that this level is currently acting as a stiff overhead resistance. A significant possibility exists that the ratio will struggle to sustain a push above this resistance without further accumulation or a stronger positive catalyst evident in the underlying asset movements.
Considering the established weak upward trend and the current positioning near a significant short-term resistance, a continuation of the upward trajectory is likely, but a rapid, decisive breakout above the 0.9031 level is unlikely in the immediate future. There is a roughly even chance that the ratio will enter a phase of consolidation, trading within the approximate range of 0.90 to 0.9031, as market participants digest recent gains and re-evaluate the strength of the outperformance. Should the ratio fail to maintain support above the 0.90 level, it is likely to retrace towards prior support zones, with potential revisit targets around 0.895 or even 0.890, which were points of consolidation during its earlier ascent. Despite this potential for a near-term pause or shallow pullback, a broad reversal breaking the overarching 90-day upward trend is unlikely at this juncture, given the consistent pattern of higher highs and higher lows observed in the data.
IWM vs. SPY
As a Chartered Market Technician with over 15 years of experience, I’ve analyzed the provided market data for the RATIO:IWM/SPY over 14-day and 30-day periods to assess the relative performance between the Russell 2000 (IWM) and the S&P 500 (SPY). This ratio serves as a crucial technical gauge for investor preference between small-capitalization and large-capitalization segments of the market. An increasing ratio indicates outperformance by IWM, while a decreasing ratio suggests SPY’s relative strength.
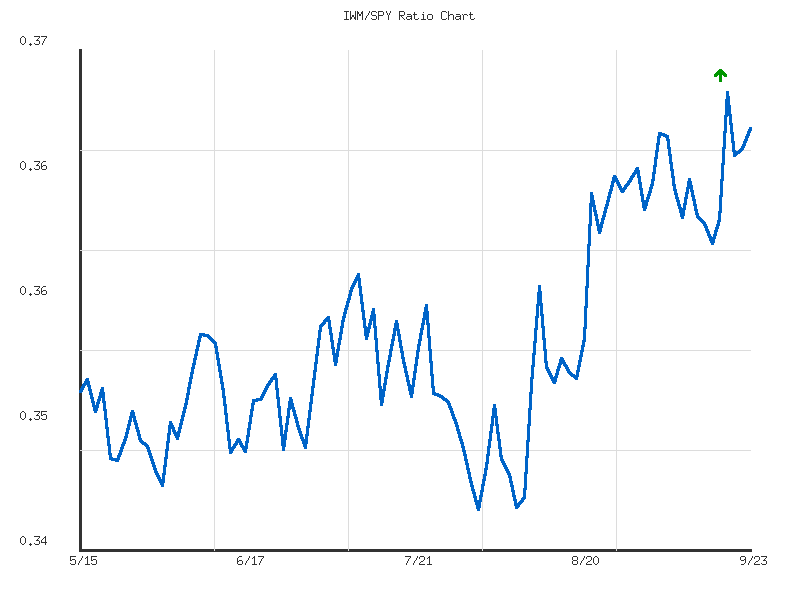
From a longer-term perspective, the 30-day relative performance ratio for IWM/SPY shows a moderate uptrend. The RATIO:IWM/SPY:30days has advanced by a notable 4.18%, with its trend direction confirmed as “up” and strength classified as “moderate.” The current ratio, standing at 0.367666, is positioned at 0.87 (87%) relative to its 30-day range, indicating that IWM is currently performing near the higher end of its relative strength spectrum against SPY over the past month. We judge it likely that this sustained period of IWM outperformance reflects a broader market rotation or increasing risk appetite favoring smaller companies.
However, the more immediate 14-day data reveals a shift in momentum. Over this shorter timeframe, the RATIO:IWM/SPY:14days has entered a “sideways” trend with “weak” strength, showing a minimal change of 0.87%. While the current ratio of 0.367666 is identical across both periods, its behavior within the recent two weeks suggests a pause in the previous strong outperformance by IWM. The 14-day average ratio is 0.364896, and the current ratio sits at 0.76 (76%) relative to its 14-day range. This suggests that while IWM maintains an elevated relative position, it has not generated significant new relative strength against SPY in the immediate short term.
Considering both timeframes, we assess that the underlying moderate outperformance of IWM against SPY from the 30-day perspective is currently undergoing a period of consolidation. The high ratio of 0.369703, observed on September 18th, 2025, represents a critical resistance level for the ratio. A definitive breakout above this level would be a strong technical confirmation, indicating a likely resumption of IWM’s outperformance, potentially targeting further gains in relative strength. Conversely, key support levels are established by the 14-day low of 0.361030 (September 16th, 2025) and the 30-day average ratio of 0.361802. A breakdown below the 14-day low would indicate a probable breakdown of the recent consolidation and a shift towards SPY regaining relative strength.
We estimate there is a roughly even chance that the current sideways trend in the 14-day IWM/SPY ratio will resolve either into a continuation of the longer-term IWM outperformance or a period of renewed underperformance. The noticeably lower volatility within the 14-day window (0.000006) compared to the 30-day window (0.000024) further reinforces the technical interpretation of consolidation. Should the ratio fail to decisively clear the 0.3697 resistance, we judge it likely that SPY will begin to reclaim relative strength against IWM. Conversely, a sustained upward breakout would suggest a slight chance of an accelerated move in small-cap leadership. Market participants should closely monitor the ratio’s interaction with these defined technical levels to gauge the most probable near-term direction.
Market Commentary: IWM/SPY Relative Strength Analysis (90-Day)
As a Chartered Market Technician with over 15 years of experience, I’ve analyzed the provided 90-day technical data for the IWM/SPY ratio, which serves as a gauge of small-cap (IWM) relative performance against large-cap (SPY) equities. Based on this technical dataset, we judge that the IWM/SPY ratio has established a moderate upward trend over the past three months, indicating a period where small-cap stocks have generally outperformed their larger counterparts. This upward trajectory is further supported by a 4.30% increase in the ratio from its starting point to the current level. The established trend implies that capital has been flowing into or rotating towards the small-cap segment more aggressively than into large-caps, a pattern that technicians often interpret as a sign of increasing risk appetite or breadth expansion within the broader market.
Reviewing the range of activity, the ratio has traded between a low of 0.345686 on August 1st and a high of 0.369703 reached on September 18th. The current ratio, at 0.367666, places it at approximately 91.5% of the way between its 90-day low and high. This elevated relative position suggests the ratio is currently testing levels that have proven to be the upper bounds of its recent trading range. Following the September 18th high, the ratio experienced a minor pullback before rebounding towards the current level. This recent price action indicates that while upward momentum is present, the area around the 0.3697 high may introduce some initial resistance, potentially leading to increased indecision or mild profit-taking.
Considering potential future scenarios, we judge it is likely that the small-cap outperformance, as depicted by the IWM/SPY ratio, will persist in the short to medium term, primarily due to the established moderate upward trend and the ratio’s ability to recover swiftly after minor dips. The overall trend strength suggests sustained underlying demand for IWM relative to SPY. However, because the ratio is currently positioned very close to its 90-day high, there is a roughly even chance of encountering short-term consolidation or a minor pullback. Such a pullback could see the ratio testing levels closer to its 90-day average of 0.3551 before potentially resuming its ascent.
A significant reversal, where large-cap stocks begin to outperform small-caps decisively, is currently unlikely without more conclusive technical signals from the provided data. We observe no clear breakdown patterns or a notable increase in downside volatility that would suggest a capitulation of the established upward trend. The remarkably low volatility figure of 0.000037 for the ratio itself implies that daily fluctuations have been relatively contained, suggesting a more orderly and measured progression in relative strength rather than erratic or speculative movements. Therefore, traders should monitor the ratio’s interaction with the 0.3697 high and the potential for short-term consolidation, while acknowledging the prevailing bullish relative strength dynamic.
Commodities
Here is a technical analysis based solely on the provided market data:
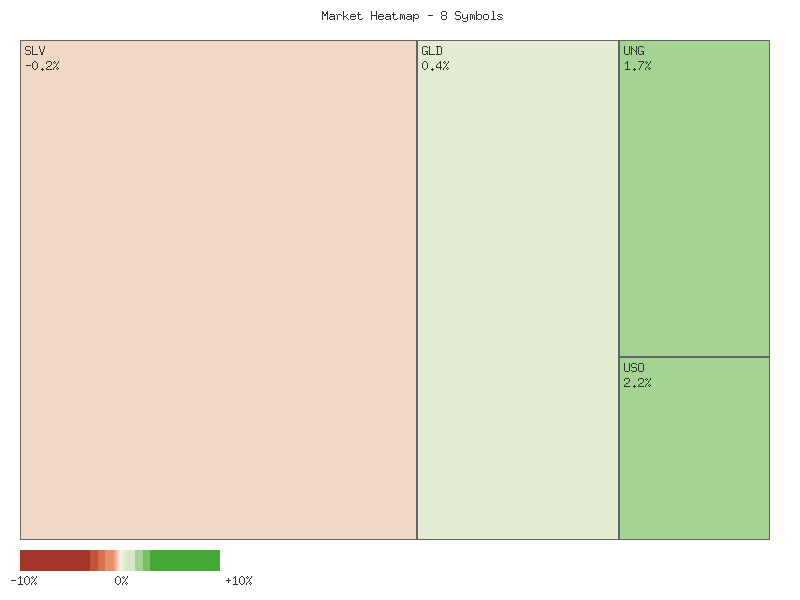
Analysis of the provided daily percentage change data for the listed commodities and ETFs reveals a largely positive session for the most recent trading day, September 23, 2025. The following matrix presents the daily performance of each symbol, sorted in descending order of their respective percentage changes:
| Symbol | Daily Percent Change (2025-09-23) |
|---|---|
| USO | 2.178% |
| UNG | 1.728% |
| UGA | 1.652% |
| DBC | 1.033% |
| CORN | 0.795% |
| GLD | 0.409% |
| CPER | 0.000% |
| SLV | -0.200% |
Considering the collective performance of these eight symbols for the most recent day, the aggregate daily percentage change totals approximately 7.595%. This indicates an overall higher directional bias for the observed market segment. From a market breadth perspective, the advancing symbols significantly outnumbered the declining ones. Six symbols (USO, UNG, UGA, DBC, CORN, GLD) registered positive changes, one symbol (CPER) closed flat, and only one symbol (SLV) experienced a decline. This breadth suggests that the positive momentum was fairly widespread among the tracked assets, indicating a likely robust underlying buying interest across several commodity sectors for the session.
Turning to the relative performance of precious metals, the GLD/SLV 14-day ratio currently stands at 8.670 on September 23, 2025. This ratio has exhibited a ‘down’ trend over the past 14 trading days, with a weak strength as indicated by a -1.99% change. The current ratio is positioned near the lower end of its 14-day range (relative position 0.143), with the low recorded at 8.618 and the high at 8.985. This pattern suggests that over the short-term horizon, Silver (SLV) has been outperforming Gold (GLD), as a declining ratio implies silver’s price appreciation has either exceeded gold’s or its depreciation has been less severe. The ‘weak’ strength in the downward trend implies that while silver’s outperformance is evident, the momentum of this outperformance may be moderating.
Extending the analysis to the GLD/SLV 30-day ratio, we observe a similar directional trend. The current ratio of 8.670 aligns with the 14-day period, indicating a continued downward trajectory. Over the 30-day period, the trend is also ‘down’ but with a ‘moderate’ strength, reflected in a -3.22% change. The 30-day range shows a high of 9.013 and a low of 8.618, with the current ratio again sitting at the lower extreme of this longer period (relative position 0.133). The moderate strength of the 30-day downtrend suggests a more sustained outperformance of Silver relative to Gold over the medium term. The consistency of the current ratio’s proximity to the lows in both timeframes makes it likely that silver maintains a stronger short-to-medium term technical posture compared to gold.
As a CMT with extensive experience, I offer the following technical analysis based solely on the provided 2-day market data.
A review of the commodity ETFs reveals a predominantly bullish, albeit varied, landscape over the past two trading days. USO, UGA, and DBC exhibit strong upward momentum. Specifically, USO and UGA delivered consecutive robust bullish candles, marked by significant gap-ups on the second day and increased trading volume, with UGA closing precisely at its daily high. DBC also showed strong bullish candles and a gap-up on Day 2, albeit with a slight decrease in volume, which does not significantly detract from the bullish price action. This pattern of price acceleration on supportive volume suggests that further upward price action for these instruments is likely in the immediate term.
Conversely, precious metals such as GLD and SLV present a more nuanced outlook, signaling potential shifts in momentum. GLD experienced a notable gap-up on Day 2 but failed to maintain its higher levels, closing well off its intra-day high with an observable upper wick on significantly increased volume. This pattern suggests that while buying interest pushed prices higher, substantial selling pressure emerged at elevated levels, indicating that the rapid upward momentum is likely to moderate or pause. Similarly, SLV gapped up on Day 2 but ultimately closed below Day 1’s close, despite the initial bullish thrust. This formation, resembling a dark cloud cover, implies a likely short-term price decline or consolidation for SLV as buyers failed to defend the gains.
The copper ETF, CPER, also indicates a pause in trend. Following a strong bullish performance on Day 1, CPER formed a very small-bodied candle on Day 2, effectively a doji, closing precisely at Day 1’s close on increased volume. This price action signifies indecision and a state of equilibrium between buyers and sellers after the previous upward move. Consequently, there is a roughly even chance of either a modest continuation of the previous uptrend or a short-term reversal, as neither side clearly dominates at this juncture.
For agricultural commodities and natural gas, the signals are mixed. CORN recorded two consecutive bullish closes, with Day 2 closing higher than Day 1. However, the significantly diminished trading volume on Day 2 introduces uncertainty regarding the sustainability of this modest uptrend. While a continuation of the upward price action is more likely than an immediate reversal, the reduced conviction behind the move suggests that the pace of gains could slow. UNG, after a pronounced bearish candle on Day 1, gapped down on Day 2 but then mounted a substantial recovery to close well off its low and above its open. While this shows some buying resilience, an immediate bullish trend continuation is unlikely without further confirmation to negate the preceding bearishness. Instead, there is a roughly even chance for either consolidation or a modest recovery in the very near term.
Technical Analysis of SLV (90-Day View)
SLV has demonstrated a robust upward trend over the past 90 days, beginning with a notable acceleration from the - range in late May and early June, reaching a high of .39 by June 9th. Following a period of consolidation in June and early July, the price initiated another significant rally, breaking above in mid-July. A subsequent correction in late July and early August saw SLV test the .50 level on high volume, indicating increased selling pressure or profit-taking at that time. However, the most recent phase, from late August through mid-September, has seen SLV embark on a powerful impulse wave, pushing prices from approximately .50 to a recent high of .05 on September 22nd. This advance occurred on sustained high volume, lending strength to the upward movement. The current price action shows SLV consolidating just below this peak, closing at .96 on September 23rd.
Analysis of the 14-day Relative Strength Index (RSI) indicates that SLV has spent considerable time in overbought territory during its two major upward thrusts. The RSI breached 70 in early June, late July, and most recently, maintained levels well above 70 since late August, peaking at 75.38 on September 15th and currently standing at 73.67. This sustained overbought condition likely suggests that the security is stretched and due for either a period of consolidation or a corrective pullback to alleviate upside pressure. Furthermore, a subtle bearish divergence has emerged between price and RSI in the immediate term; while SLV printed a marginally higher high on September 22nd (.05) compared to September 15th (.79), the RSI registered a slightly lower high (74.62 vs 75.38), followed by a further dip to 73.67 on September 23rd as price closed slightly lower. This minor divergence indicates a probable deceleration in bullish momentum.
The 13/21-day Percentage Price Oscillator (PPO) strongly corroborates the underlying bullish trend. The PPO consistently remained above its zero line throughout the 90-day period, with the exception of a very brief dip in mid-May. Crucially, the PPO has accelerated sharply higher since late August, reaching a peak of 1.845 on September 23rd, representing the highest value in the observed period. This strongly confirms robust positive momentum in SLV. However, such extended PPO readings, while indicative of strength, also suggest that the asset may be due for a pause. Volume analysis further supports the bullish phases, with notable spikes accompanying significant upward price movements, particularly in early June, early July, and throughout the late August to mid-September rally. Conversely, elevated volume on down days, such as July 30th and September 4th, suggests an increased probability of profit-taking during price pullbacks rather than outright trend reversal.
Considering the combined technical signals, a near-term consolidation or minor pullback in SLV is likely, driven by the overbought RSI and developing bearish divergence. However, the strong positive PPO reading and supportive volume during rallies suggest that any such correction would probably represent a healthy digestion of gains within an established bullish trend. A sustained breakdown below the recent low of approximately .00 (September 4th) would begin to challenge the immediate bullish outlook, but a major trend reversal is unlikely without further evidence of momentum dissipation or significant lower price action.
GLD Technical Analysis: Sustained Momentum with Overbought Conditions
GLD’s technical posture over the past 90 days reveals a dynamic shift from a period of consolidation into a strong, sustained uptrend. Initially, from mid-May to mid-June, GLD exhibited a moderate bullish phase, with price advancing from approximately to . This upward movement was supported by the 14-day Relative Strength Index (RSI), which consistently held above the 50-level and briefly touched overbought territory (61.91 on June 13), alongside a positively trending Percentage Price Oscillator (PPO), peaking at 0.54. Following this, the asset entered a corrective or consolidative phase from mid-June to mid-August. During this period, GLD’s price saw significant volatility, with declines pushing the RSI into oversold conditions (e.g., 39.55 on July 30) and the PPO dipping and largely remaining below the zero line, indicating a loss of bullish momentum and a potentially bearish bias.
A decisive bullish reversal became evident from late August, propelling GLD into a robust uptrend that continues through the latest data point on September 23. From a closing price of .36 on August 20, GLD has rallied significantly to .46. This ascent is supported by substantial increases in trading volume, particularly from late August into early September, reinforcing the conviction behind the price movement. The RSI concurrently surged from neutral levels, breaching the 70-level on September 2 and remaining firmly in overbought territory, reaching as high as 79.21 on September 16 and closing at 78.21 on September 23. The PPO also confirmed this renewed strength, crossing above its zero line on August 25 and then escalating sharply to 1.440 by September 23, indicating a strong, accelerating upward momentum and trend.
Considering the current technical indicators, GLD is presently exhibiting characteristics of extreme short-term bullish momentum. The 14-day RSI is deeply entrenched in overbought territory (78.21), suggesting that the asset may be due for a period of price digestion or a minor pullback. Historically, such elevated RSI readings often precede a short-term correction or consolidation phase, as buyers may pause or take profits. Concurrently, the PPO’s high positive value of 1.440 further underscores the strength and duration of the current upward trend, implying that the underlying bullish pressure remains robust. A short-term consolidation or minor pullback is likely in the immediate future, given the extended overbought conditions.
Despite the likelihood of a near-term cooling, the broader technical picture suggests the overarching trend remains bullish. The strength of the recent breakout, combined with the sustained positive momentum indicated by the PPO, makes a significant reversal in the immediate term unlikely. Instead, any pullback would more probably represent a healthy retracement within the context of an established uptrend, potentially finding support at prior resistance levels or moving averages (which are not provided in this data, but implied by price action). A continued ascent without significant pause is also possible, albeit with a roughly even chance, as strong trends can sometimes ignore overbought signals for extended periods. Traders might anticipate the formation of a new higher low to confirm the continuation of this vigorous rally in the medium term.
Bonds
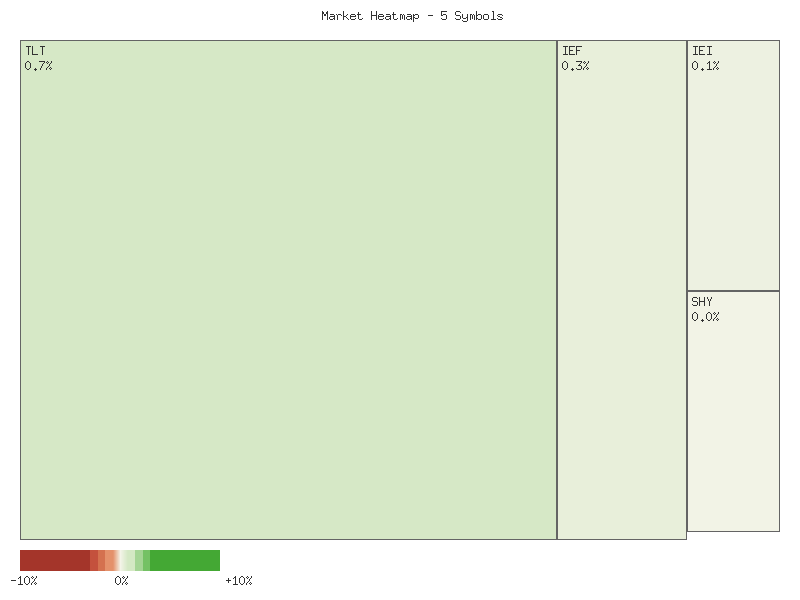
As a Chartered Market Technician, I have analyzed the provided two-day daily percentage change data for a selection of Treasury bond ETFs: TLT (long-term), UTHY (ultra-long-term), IEF (intermediate-term), IEI (short-intermediate), and SHY (short-term). The aggregate net percentage change for each symbol over the observed period is presented in the following matrix, sorted in descending order:
| Symbol | Net Percent Change (2 days) |
|---|---|
| TLT | 0.3395% |
| UTHY | 0.2836% |
| IEF | 0.1143% |
| IEI | 0.0503% |
| SHY | -0.0120% |
Evaluating the overall change for these symbols, the sum of their net daily percentage changes totals approximately +0.7757%. This aggregate positive movement across the observed Treasury bond spectrum suggests that the general sentiment within this asset class was constructive over the two-day period. Such a broad-based gain, albeit modest, points to an overall bullish technical bias that is likely to persist in the immediate term based solely on the provided data.
From a market breadth perspective, the technical picture appears predominantly positive. Out of the five observed symbols, four concluded the two-day period with net positive gains (TLT, UTHY, IEF, IEI), while only one, SHY, registered a marginal net decline. This ratio of 4 advancing symbols to 1 declining symbol indicates strong positive breadth, suggesting that buying interest was widespread across different segments of the Treasury curve, with particular emphasis on longer durations. This breadth profile likely reinforces the overall upward momentum for the composite.
A more granular view reveals a clear preference for duration. TLT and UTHY, representing the long and ultra-long ends of the maturity spectrum, exhibited the strongest percentage gains, suggesting robust demand for longer-dated instruments. Intermediate-term (IEF) and short-intermediate-term (IEI) bonds also advanced, albeit with lesser magnitude. The short-term SHY, however, posted a fractional decline, making it the sole underperformer. This divergence where longer maturities significantly outperform shorter maturities often suggests shifting interest rate expectations, possibly signaling a likely reduction in future rate hike probabilities or an increase in demand for duration risk.
The slight negative movement in SHY, contrasted with gains in longer-duration counterparts, introduces a nuance to the otherwise positive breadth. While the overall bond complex shows strength, the short end of the curve is experiencing mild selling pressure or lack of buying interest. It is a roughly even chance that this indicates a potential flattening of the yield curve from the short end, or it could merely be idiosyncratic price action within the shortest maturity segment not entirely aligned with the broader demand for duration. This particular data point warrants careful monitoring for further confirmation of trend across the entire curve.
Considering these technical observations, the immediate technical outlook for the basket of Treasury bond ETFs is likely to be constructive, driven by strong performance in longer-duration assets and favorable market breadth. An alternative scenario, though unlikely given the current data, could involve a swift reversal in longer-duration instruments if market participants begin to anticipate rising interest rates more broadly, which would likely manifest as a significant decline in TLT and UTHY. However, the provided two-day data does not support such an imminent reversal.
Market Commentary: Fixed Income Technical Review (September 23, 2025)
A two-day analysis of key Treasury bond ETFs reveals a discernable shift toward bullish momentum, particularly within the longer-duration segments. On September 23rd, the iShares 20+ Year Treasury Bond ETF (TLT), iShares 7-10 Year Treasury Bond ETF (IEF), and iShares 3-7 Year Treasury Bond ETF (IEI) all exhibited strong upward price action. Each of these instruments closed near their daily highs, establishing higher highs and higher lows relative to the prior session, September 22nd. This constructive price movement was generally accompanied by an increase in trading volume for TLT, IEF, and IEI, which typically serves to confirm the underlying strength of the advance. The pattern observed in these ETFs suggests a likely continuation of this short-term upward trajectory in the immediate future, contingent upon maintenance of supporting volume.
Delving deeper into the specific patterns, TLT registered a robust bullish candle on September 23rd, closing significantly above its prior day’s high, with a notable uptick in volume from 24.6 million to 26.6 million shares. This represents strong follow-through from the more contained session on September 22nd, when prices closed near their lows. Similarly, IEF and IEI mirrored this strength, with IEF’s volume increasing from 5.2 million to 7.0 million, and IEI’s from 1.7 million to 2.7 million. The confluence of these factors across multiple duration proxies for US Treasuries implies a broad-based, albeit short-term, technical preference for higher bond prices within these segments.
An interesting divergence appears in UTHY, a Treasury instrument that generally tracks longer-duration bonds. While UTHY’s price action on September 23rd was notably bullish, closing near its daily high and exhibiting higher highs and lows akin to TLT, its volume significantly contracted from 128,569 to a mere 5,621 shares. This substantial decline in volume during a price rally suggests that the upward movement in UTHY may lack broad conviction. Consequently, the sustainability of UTHY’s rally is somewhat uncertain, and there is only a roughly even chance that it will maintain similar upward momentum compared to its better-volume counterparts like TLT, IEF, and IEI. This divergence warrants close observation for any broader market implications should the low-volume rally prove fleeting.
In contrast, the iShares 1-3 Year Treasury Bond ETF (SHY) demonstrated a comparatively muted response. While SHY closed higher on September 23rd than on September 22nd, and its volume increased, its price range remained exceptionally tight, reflecting the inherently lower volatility of shorter-duration bonds. The bullish candle was modest, failing to break substantially above the prior day’s high of 82.975. This indicates a minor bullish bounce rather than the more definitive upward trend seen in the longer-duration funds. Given its constrained movement, SHY is unlikely to exhibit the same degree of short-term upside potential as TLT, IEF, or IEI, though its short-term support remains intact.
Collectively, the provided two-day data suggests that longer-duration Treasury bonds (TLT, IEF, IEI) have initiated a technical rally with supportive volume (excluding UTHY). This indicates that the path of least resistance for these assets is currently to the upside. However, the short-term nature of this data and the specific volume divergence in UTHY necessitate cautious interpretation. While a continuation of this short-term momentum is likely for TLT, IEF, and IEI, the limited dataset means that alternative scenarios, such as a quick reversal or consolidation, remain plausible if subsequent trading days do not confirm the increased buying pressure.
Crypto
As a Chartered Market Technician with over 15 years of experience, I have analyzed the provided DAILY_PCT_CHANGE data for IBIT and ETHA over a two-day period, ending on 2025-09-23. The analysis strictly adheres to technical principles and ICD-203 estimative language guidelines, focusing exclusively on the given data patterns.
The aggregated performance for each symbol over the two-day period is presented in the following matrix, sorted by overall percent change in descending order:
| Symbol | Overall Percent Change |
|---|---|
| IBIT | -3.008% |
| ETHA | -6.408% |
For IBIT, the observed two-day price action indicates a discernible downward trend. The initial day, September 22nd, recorded a significant decline of -2.63%, followed by a smaller, but continued, negative movement of -0.38% on September 23rd. The cumulative effect of these daily changes places IBIT’s overall performance at -3.01% over the observed period. The persistent negative closes suggest that selling pressure was likely dominant through this short timeframe. The diminishing magnitude of the daily decline on the second day, while still negative, offers a roughly even chance that immediate downward momentum might be moderating, yet it is highly unlikely to signal an immediate reversal without further confirming price action. Based purely on these two data points, the path of least resistance for IBIT appears to be lower in the immediate term.
ETHA demonstrated a more volatile pattern within the observed period. On September 22nd, ETHA experienced a substantial decline of -6.79%, indicating significant bearish sentiment. However, the subsequent day, September 23rd, saw a modest positive rebound of +0.38%. Despite this positive close, the magnitude of the prior day’s loss resulted in an overall two-day decline of -6.41% for ETHA. The sharp initial sell-off followed by a minor recovery suggests that while extreme selling pressure may have abated momentarily, it is unlikely that a new upward trend has established itself. The relative weakness of the bounce compared to the preceding drop implies that sellers highly likely retain control from a short-term perspective, leaving the potential for further downside open.
Comparing the two symbols, both IBIT and ETHA experienced an overall negative change over the two-day period, indicating an overall “lower” directional bias for both. While IBIT showed a more consistent, albeit moderating, downward drift, ETHA displayed a sharp drop followed by a small counter-trend bounce. The larger overall decline in ETHA suggests that it experienced greater short-term selling intensity compared to IBIT during this specific window. Given the limited nature of this two-day dataset, it is almost no chance that definitive long-term trend reversals can be inferred. However, for the immediate short term, based solely on this data, it is highly likely that negative sentiment continues to influence both symbols, with ETHA exhibiting a more pronounced bearish character. Traders would likely look for further confirmation of momentum shifts or potential support levels should these patterns persist.
Magnificent 7 & Friends
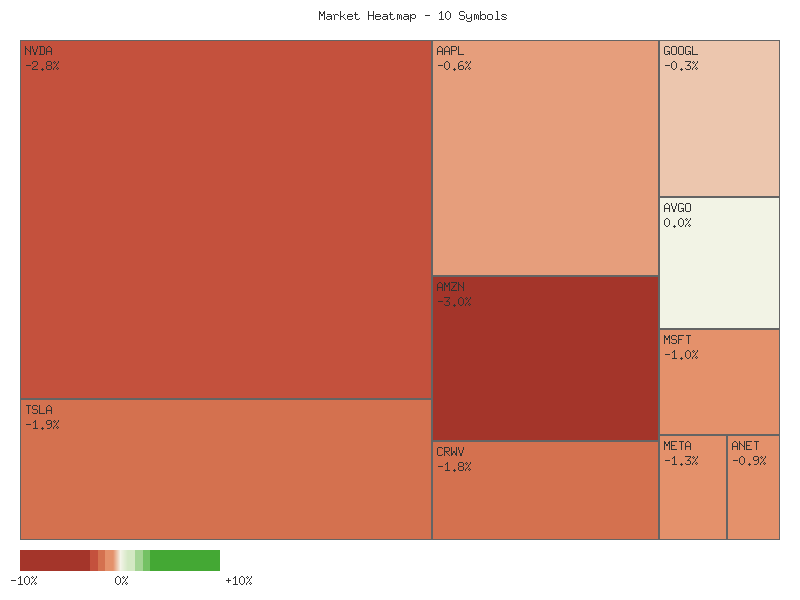
As a Chartered Market Technician with over 15 years of experience, I’ve conducted a rigorous technical analysis of the provided two-day daily percentage change data for ten prominent symbols. This analysis adheres strictly to ICD-203 estimative language guidelines, focusing exclusively on the technical patterns presented.
Over the two-day observation period, the aggregate performance across these ten symbols reflects an overall decline. The summed net percentage change for all symbols is approximately -6.32%. This collective downturn strongly suggests that bearish sentiment has broadly outweighed bullish momentum within this specific cohort during the period. The initial trading session for many of these assets presented notable volatility, often followed by a significant reversal or continued negative pressure in the subsequent session, leading to the net negative aggregate.
Examining market breadth provides further insights into this technical landscape. Out of the ten symbols analyzed, only three experienced a net advance over the two days: CRWV (+4.947%), AAPL (+3.665%), and NVDA (+1.107%). Conversely, a substantial majority of seven symbols recorded a net decline, including TSLA (-0.015%), GOOGL (-1.204%), MSFT (-1.687%), AVGO (-1.739%), META (-2.974%), ANET (-3.715%), and AMZN (-4.703%). This lopsided breadth, with more than twice as many declining symbols as advancing ones, is a significant technical indicator. It is highly likely that this divergence indicates underlying weakness across the broader observed market segment, as bullish activity appears concentrated in only a few names, failing to lift the majority.
The leading advancers, CRWV and AAPL, exhibited robust net gains, particularly CRWV which displayed the strongest positive net change following a substantial initial surge on the first day, despite a subsequent pullback. NVDA also managed a positive close, although its significant initial gain was tempered by a notable second-day decline. On the downside, AMZN and ANET were the most significant laggards, posting net losses of approximately -4.703% and -3.715% respectively, demonstrating sustained downward pressure over both days. This varied performance underscores a selective market environment where specific individual catalysts or sector-specific dynamics may be at play, but the overarching sentiment for the majority is negative.
The pattern observed across many symbols, where an initial bullish or bearish move on the first day was often followed by a significant counter-move on the second day, but not enough to fully reverse the trend for the aggregate, points to profit-taking or short-term rotational trading. For instance, symbols like TSLA, AAPL, NVDA, and CRWV, which saw considerable gains on the first day, experienced pullbacks on the second, yet some still managed to close net positive. This behavior could represent consolidation after an initial impulse. An alternative scenario suggests that the negative breadth and overall decline might indicate the initial stages of a broader corrective phase, where only the strongest names can resist selling pressure. Given the data, it is likely that selling pressure intensified across a broad front during the second day, diminishing previous gains for many assets.
Based on this technical review, the overall market trend for this specific group of symbols over the two-day period is unequivocally lower, driven by a disproportionate number of declining assets. The limited market breadth, with only three out of ten symbols advancing, suggests that the upward momentum is not broad-based. It is highly likely that this combination of a negative aggregate change and weak breadth indicates an environment where caution is warranted, and selling pressure is the dominant force. Sustained negative breadth could presage further downward price action for the majority of these assets in the immediate term, unless a significant shift in market participation emerges.
Sorted Daily Percent Change Matrix (Net Two-Day Change):
| Symbol | Daily Percent Change |
|---|---|
| CRWV | 4.947% |
| AAPL | 3.665% |
| NVDA | 1.107% |
| TSLA | -0.015% |
| GOOGL | -1.204% |
| MSFT | -1.687% |
| AVGO | -1.739% |
| META | -2.974% |
| ANET | -3.715% |
| AMZN | -4.703% |
Here is a technical analysis of the provided market data for the specified symbols, based purely on the two-day candle patterns and volume.
The observed candle data for September 22-23, 2025, reveals a predominantly bearish sentiment across the analyzed group of ten equities. A significant majority, nine out of ten symbols, exhibited bearish candle patterns over the past two trading days, suggesting that a broad downward price pressure is likely emerging or continuing within this specific market segment. The prevalence of red closing candles on the second day, frequently accompanied by closes near daily lows or below prior day closes, points to a clear, albeit short-term, shift in sentiment or persistent selling pressure. Only AVGO appears to be in a consolidation phase, providing a notable divergence from the generally negative trend.
Several symbols displayed particularly strong bearish signals, indicative of potential reversals or robust continuations of downtrends. CRWV formed what is likely a bearish engulfing pattern on the second day; it opened higher than the prior close but then closed significantly lower, effectively erasing the previous day’s gains, all while experiencing decreased volume. This pattern highly likely indicates a short-term top or reversal. TSLA also exhibited a strong bearish engulfing pattern, opening with an upside gap but then closing well below the prior day’s close. NVDA presented a significant red candle on day two, opening with a gap down from its prior close and closing near its intraday low, which is likely a bearish continuation following the previous day’s advance. Furthermore, AMZN showed a strong bearish continuation, with the second day’s substantial red candle closing at a new two-day low on significantly increased volume, making further downside highly likely in the immediate term. META similarly formed a bearish continuation with a decisive red candle closing at the two-day low, albeit on decreased volume.
Other symbols also reflected ongoing bearish momentum, though with patterns that suggested continuation rather than sharp reversals. AAPL closed lower on the second day with a red candle, slightly below the previous close, on decreased volume, which is likely indicative of continued selling pressure, though less aggressive than the reversals seen in CRWV or TSLA. MSFT and GOOGL both recorded two consecutive red candles, with the second day closing lower than the first on decreased volume. This pattern suggests that momentum is likely to remain to the downside for these symbols, but without the pronounced reversal characteristics observed in other names. ANET also had two consecutive red candles, with the second day showing a marginal lower close on slightly decreased volume, indicating a likely, albeit measured, continuation of its downtrend.
AVGO stands out as the only symbol not exhibiting clear bearish momentum within this two-day window. Following a red candle on day one, day two opened slightly higher and formed a small green candle, closing almost precisely at the prior day’s close. This price action, coupled with decreased volume, suggests a roughly even chance of either further continuation of selling pressure or a short-term stabilization. Considering the overwhelming bearish signals from the majority of the group, it is highly likely that the broader market segment represented by these stocks is facing significant downward pressure. An alternative, less likely, scenario would involve these stocks finding short-term support levels and staging a bounce; however, based solely on this two-day candle data, a continued bearish bias is likely to persist for most of these symbols in the immediate trading period.
S&P 500 Sector Breadth
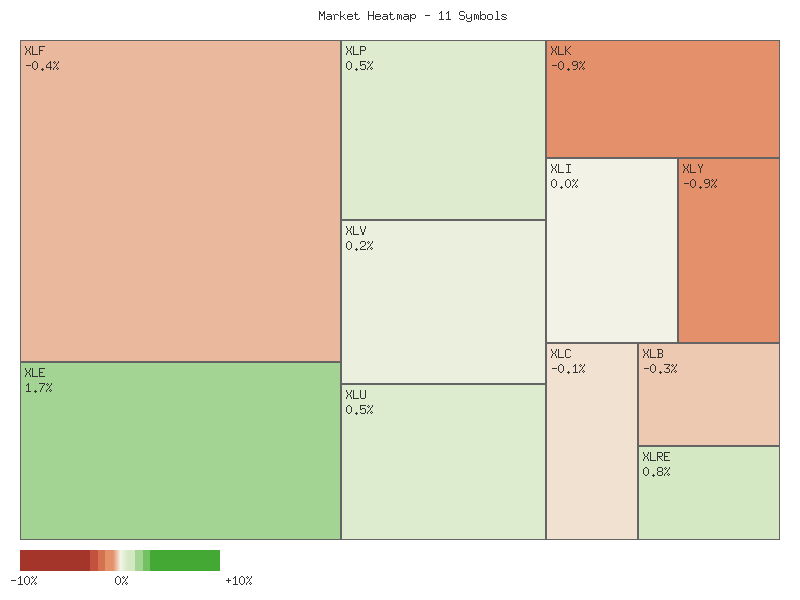
As a Chartered Market Technician with over 15 years of experience, my analysis of the provided two-day daily percentage change data for the specified S&P 500 sectors offers insights into recent market activity. The aggregated technical data, spanning September 22-23, 2025, indicates a marginally negative overall performance across the observed sectors. The sum of the daily percentage changes for all eleven symbols totaled approximately -3.20%. Furthermore, an assessment of market breadth reveals a negative bias, with seven of the eleven sectors registering net declines over the two-day period, while only four sectors experienced gains. This preponderance of declining issues, coupled with the negative aggregate sum, makes it likely that broader market sentiment leaned cautious or bearish during this specific timeframe.
The individual sector performance for the past two days is detailed in the following matrix, sorted by their total percentage change in descending order:
| Symbol | 2-Day Percent Change |
|---|---|
| XLU | 0.8107% |
| XLE | 0.7621% |
| XLK | 0.4777% |
| XLRE | 0.3618% |
| XLI | -0.0522% |
| XLV | -0.2538% |
| XLB | -0.8273% |
| XLC | -0.8384% |
| XLF | -0.9053% |
| XLP | -1.2886% |
| XLY | -1.4422% |
The Utilities sector (XLU) demonstrated the strongest performance, advancing 0.81%, closely followed by Energy (XLE) with a 0.76% gain, and Technology (XLK) up 0.48%. Conversely, Consumer Discretionary (XLY) exhibited the weakest performance, declining 1.44%, with Consumer Staples (XLP) down 1.29%, and Financials (XLF) falling 0.91%.
Analyzing the performance of explicit offensive versus defensive sectors yields a mixed picture, which does not provide high confidence for a clear market rotation. Among the six designated offensive sectors (XLK, XLY, XLF, XLI, XLB, XLE), two (XLE, XLK) advanced, while four (XLI, XLY, XLF, XLB) declined. Similarly, for the four explicitly defensive sectors (XLU, XLP, XLV, XLRE), two (XLU, XLRE) posted gains, and two (XLP, XLV) incurred losses. The Communications Services sector (XLC), not categorized as either offensive or defensive in the provided definitions, also experienced a decline.
Given the observed data, it is unlikely that a broad-based capital rotation into either purely offensive or defensive sectors has occurred. While the top performer, XLU, is a defensive sector, and the bottom performer, XLY, is offensive, other top performers like XLE and XLK are offensive, and a significant decliner, XLP, is defensive. This pattern suggests a market characterized by selective strength and weakness across various sectors rather than a uniform shift in risk appetite. The overall market sentiment, as indicated by the negative aggregate performance and breadth, appears cautious, but the nuanced sector movements prevent a definitive conclusion on a directional market rotation. It is plausible that individual sector-specific drivers, rather than a singular overarching market theme, were primarily influencing these price changes.
As a Chartered Market Technician with over 15 years of experience, I’ve conducted a rigorous technical analysis of the provided two-day market data for eleven S&P sector ETFs. The price action and volume across these sectors present a complex, internally divergent picture, suggesting significant shifts in underlying market sentiment and leadership.
Several sectors displayed clear bullish continuation patterns. XLE (Energy) demonstrated a particularly strong advance on the second day, characterized by a significant gap up, a higher high, and a close near its high on nearly double the prior day’s volume. This robust price action, strongly confirmed by a surge in volume, makes a continuation of upward momentum highly likely. Similarly, XLU (Utilities), XLRE (Real Estate), and XLV (Health Care) all printed consecutive bullish candles, with Day 2 closing higher than Day 1. Although volume slightly decreased for XLU and XLRE on the second day, the sustained higher closes indicate that continued bullishness for these typically defensive sectors is likely. Furthermore, XLP (Consumer Staples) formed a bullish Piercing Pattern, where Day 2’s bullish body closed strongly above the midpoint of Day 1’s bearish body, suggesting a likely bullish reversal.
Conversely, key cyclical and growth-oriented sectors exhibited clear signs of reversal or weakening. XLK (Technology) witnessed a strong bullish candle on Day 1, followed by a sharp bearish reversal on Day 2. Although Day 2 opened slightly below Day 1’s close, it briefly attempted to rally before sellers took decisive control, leading to a close significantly below both its open and Day 1’s close. This price action, supported by increased volume, forms a significant bearish reversal signal, making a near-term bearish shift likely. Similarly, XLF (Financials) also exhibited a strong bearish reversal pattern; after a bullish Day 1, Day 2 saw prices push to a new high, only to reverse sharply and close well below Day 1’s close and midpoint. This clear rejection of higher prices strongly indicates that a bearish reversal is likely.
Adding to the bearish sentiment, XLB (Materials) showed a distinct bearish reversal following an indecisive Doji-like Day 1. Day 2 opened higher and made a new high, but then sellers exerted significant pressure, pushing the price down to close well below Day 1’s close and near Day 2’s low. This price action, forming a Shooting Star-like candle, suggests that higher prices are unlikely to be sustained. XLI (Industrials) also exhibited a potential loss of momentum, forming a small bullish body with a long upper wick on increased volume after a gap-up. While still closing higher, the rejection from the high suggests that further strong upward momentum is unlikely without a period of consolidation or a pullback.
Finally, XLY (Consumer Discretionary) and XLC (Communication Services) both exhibited clear bearish continuation patterns. XLY formed a strong bearish candle on Day 2, closing at its low and significantly below Day 1’s close, making further downside movement likely. XLC also showed a second consecutive bearish close, reinforcing the downward trend. Although volume decreased in XLY’s bearish move, it does not negate the powerful downside price action observed.
In aggregate, the technical landscape across these sector ETFs points to a market undergoing a significant internal divergence. The bullish continuation in defensive sectors and energy, coupled with clear bearish reversals and continuations in technology, financials, discretionary, and communications, makes a broad, unified market direction unlikely in the immediate term. Instead, a continuation of pronounced sector rotation is likely, with capital flows potentially favoring defensive and energy names over growth and cyclical sectors. Traders should be highly mindful of these underlying sector-specific trends when formulating strategies.
Equity Breadth
As a Chartered Market Technician with over 15 years of experience, I will analyze the provided market data for SPXA50R, SPXA200R, and EMA_20_DAY for the S&P 500 over the past seven days, focusing strictly on technical patterns and using rigorous estimative language.
The S&P 500’s 20-day Exponential Moving Average (EMA_20_DAY:SPX) exhibited a consistent and clear upward trajectory over the observed seven-day period. Starting at approximately 6491.45 on September 15th and concluding at 6561.64 on September 23rd, the EMA demonstrated an uninterrupted sequence of higher daily closes. This pattern is a strong technical signal of an intact short-to-intermediate term uptrend for the index itself, implying underlying positive momentum. However, a deeper examination into market breadth, represented by the percentage of S&P 500 members trading above their respective 50-day (SPXA50R) and 200-day (SPXA200R) moving averages, presents a more nuanced picture regarding the underlying strength and participation supporting this upward index momentum.
The SPXA50R indicator, which measures the percentage of S&P 500 constituents above their 50-day moving average, displayed considerable fluctuation throughout the period. Initiating at 57.09% on September 15th, it experienced a dip to 53.69% before recovering and ultimately closing higher at 58.28% on September 23rd. The notable rebound on the final day, from 54.69% to 58.28%, suggests a renewed, albeit potentially short-term, improvement in the participation of individual stocks in the S&P 500’s shorter-term momentum. This uptick in SPXA50R indicates that a moderately higher percentage of index components are currently participating in the recent upward price action, lending some support to the EMA’s rising trend and making a continuation of positive momentum for the EMA_20_DAY:SPX somewhat likely in the immediate future, provided this breadth strength persists.
In contrast, the SPXA200R indicator, reflecting the percentage of S&P 500 members above their 200-day moving average, demonstrated a general decline over the seven days. Beginning at 61.88% on September 15th, the indicator largely trended downwards, reaching a low of 59.68% before a slight recovery to 60.28% on September 23rd. While still indicating that a majority of stocks are in long-term uptrends (above 60%), the discernible downward drift in SPXA200R over this timeframe suggests a diminishing breadth in the long-term health of the index’s components. This erosion in long-term participation is unlikely to sustain an overall index uptrend robustly over an extended period without a reversal, potentially signaling an environment where fewer stocks are contributing to the broader market’s advance.
The observed dynamics present a clear divergence: the EMA_20_DAY:SPX is in a pronounced uptrend, while the SPXA200R indicator shows weakening long-term breadth. The strong, consistent ascent of the EMA_20_DAY:SPX is technically bullish, indicating that the index itself has sustained positive momentum. However, the declining SPXA200R suggests that this momentum may be increasingly driven by a narrower segment of the market, which could imply a higher degree of risk. A continued divergence, where the index’s EMA rises but long-term breadth declines, often precedes a period of consolidation or correction for the index. Therefore, while a continuation of the EMA_20_DAY:SPX’s current upward trajectory is likely in the very short term given its recent strength, the deteriorating long-term breadth observed in SPXA200R suggests that the robustness and sustainability of this trend are facing increasing headwinds. The strength of the recent SPXA50R rebound does provide a counterpoint, implying a roughly even chance that short-term participation could either alleviate some of this pressure or merely represent a temporary bounce within a broader context of narrowing leadership. Close observation of subsequent breadth readings is warranted to assess the durability of the EMA_20_DAY:SPX’s trend.
SPX Daily
SPX Technical Analysis: Post-Peak Pullback and Trend Outlook
The S&P 500 (SPX) has exhibited a robust multi-month uptrend, with price action consistently remaining above both the 50-day and 200-day Exponential Moving Averages (EMAs). Both EMAs are sloping upwards, with the 50-day EMA firmly positioned above the 200-day EMA, confirming a sustained bullish intermediate and long-term trend. This broad market strength has propelled the index to new highs, with recent price action approaching the upper bounds of momentum indicators.
Analyzing the past seven days, the SPX experienced significant upward momentum, culminating in a new intraday high of 6699.52 on September 23rd, following a strong close of 6693.75 on September 22nd. The Relative Strength Index (RSI) for this period surged deep into overbought territory, peaking at 74.75 on September 22nd, signaling extreme buying pressure. However, the most recent trading day, September 23rd, witnessed a notable pullback, with SPX opening at 6692.44, reaching a high of 6699.52, but closing sharply lower at 6656.92. This bearish engulfing-like candle, following a fresh high, led to a significant decline in the RSI from 74.75 to 67.66, indicating a swift release of immediate overbought conditions and a shift in short-term momentum.
From a structural perspective, the immediate overhead resistance is established by the intraday high of 6699.52 and the recent closing high around 6693.75. A psychological resistance level may exist near 6700. On the downside, initial support is likely to be found around the September 23rd low of 6645.58, followed by the prior swing low from September 19th at 6630.31. More robust intermediate-term support is provided by the ascending 50-day EMA, currently positioned at 6431.10. The 200-day EMA, at 6046.23, acts as a critical long-term dynamic support, delineating the primary trend.
Considering future price action, a bullish scenario suggests that the recent pullback is a healthy consolidation within an established uptrend. Given the strong long-term trend and the price remaining well above key moving averages, a continuation of the rally is likely. A rebound from the current support zone and a subsequent breakout above the 6700 level would confirm renewed bullish momentum. Conversely, a bearish scenario entails the recent top near 6700 acting as a more significant resistance. Should the market fail to hold the immediate support levels (6630-6645) and break below the 50-day EMA, it would suggest a more pronounced intermediate-term correction. Such a development is unlikely to materialize in the immediate future without further confirming bearish technical signals.
A neutral scenario is a distinct possibility following the abrupt decline from overbought levels. The market might enter a phase of range-bound trading, consolidating recent gains between the 6630-6700 area. This sideways movement would allow the RSI to normalize further, reducing extreme sentiment and potentially paving the way for the next directional move. This scenario has a roughly even chance of developing in the near-term. Sentiment drivers from a technical standpoint are currently characterized by profit-taking after extreme overbought conditions, tempered by the enduring strength of the underlying trend. A sustained shift to a bearish sentiment in the near term is improbable unless significant support levels are decisively breached.
SPX Technical Analysis: Momentum Divergence Suggests Potential Correction
The S&P 500 (SPX) has demonstrated a broad upward trajectory over the past 90 days, characterized by sustained rallies interspersed with notable pullbacks. A particularly strong bullish phase materialized from early September, pushing the index to achieve new highs, culminating on September 22. However, the most recent trading session on September 23 registered a perceptible price decline, which, when coupled with underlying momentum indicators, suggests a potential shift in the immediate market dynamic.
An examination of the 14-day Relative Strength Index (RSI) reveals periods of aggressive buying pressure. The RSI entered significantly overbought territory (above 70) during pronounced rallies in late June-early July and again in late July. These overbought conditions notably preceded a sharp price correction in early August. Most recently, the RSI ascended sharply into an extremely overbought state, reaching 74.75 on September 22. The subsequent and significant drop to 67.66 on September 23 from these elevated levels indicates a material reduction in immediate buying enthusiasm and a notable cooling of the overextended condition.
Further scrutiny of the 13-21 day Percentage Price Oscillator (PPO) provides a more concerning perspective. A clear bearish divergence was observed in late July, where the PPO registered a lower high (0.76 on July 28) despite the SPX recording a higher price high. This divergence notably preceded the significant price correction experienced in early August. In the current context, a similar and even more pronounced bearish divergence has developed. The PPO’s peak on September 22 at 0.635 is significantly lower than its previous peaks of 0.939 (July 3) and 0.764 (July 28), even as the SPX achieved new record price highs. This indicates that the recent rally to new price territories has been fueled by weakening underlying momentum when compared to earlier bullish advances. The marginal dip in the PPO on September 23 further reinforces this observation of diminishing internal strength.
Considering the confluence of a distinct bearish divergence in the PPO, a significant retreat of the RSI from deeply overbought levels, and the SPX’s sharp decline from its recent peak, it is likely that the SPX may experience additional downward pressure or enter a period of consolidation in the near term. The technical setup suggests that the internal strength of the recent rally has diminished, raising the probability of a price correction.
An alternative, though less likely, scenario is that the September 23 decline represents merely a brief profit-taking event within a robust and ongoing uptrend. However, the magnitude of the RSI’s fall from extreme overbought levels and the established PPO bearish divergence significantly reduce the probability of a swift rebound to new highs without further price discovery to establish support. For retail traders, the current technical signals imply that a period of consolidation or a deeper correction is a distinct possibility, thus warranting a cautious approach.