Daily Market Technical Analysis
Daily Market Technical Analysis
Market Overview
The market presents divergent technical signals with major indices (SPX, QQQ) displaying strong bullish momentum, led by Technology (XLK) and large-caps. Small-caps (IWM) show a probable bullish reversal, but mid-caps (MDY) remain weak. A significant VIX increase and deteriorating S&P 500 breadth indicate rising short-term volatility and narrowing market leadership, making sustained broad market advances unlikely without broader participation. Precious metals are highly likely to extend their strong uptrends, while bonds are very likely to face continued downward pressure. Overbought conditions across key indices suggest a roughly even chance of near-term consolidation or minor pullbacks, warranting cautious strategic adjustments.
Market Indices
Technical Market Commentary (September 22, 2025)
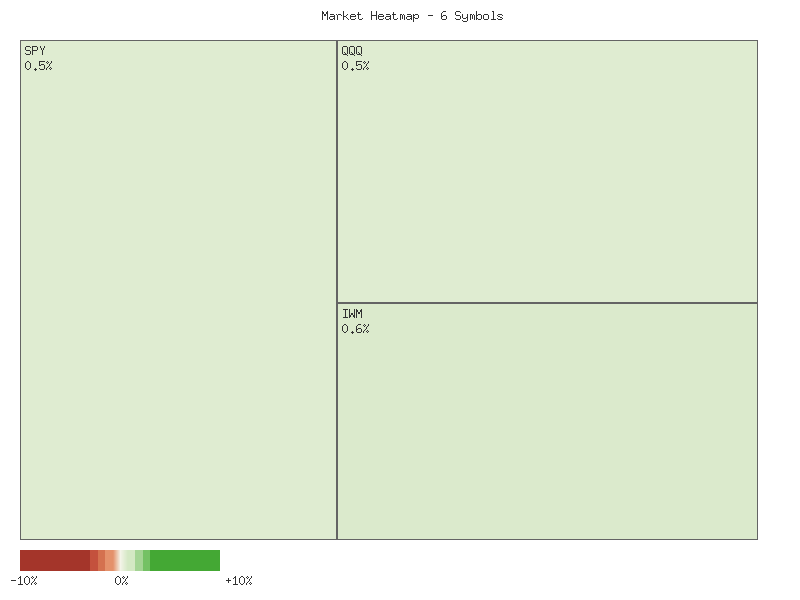
The daily performance of key market indices and ETFs indicates a broadly positive sentiment for the session, albeit with underlying divergences suggesting increasing market uncertainty. The following matrix details the daily percentage changes:
| Symbol | Daily Percent Change |
|---|---|
| IWM | 0.5803% |
| OEF | 0.5718% |
| QQQ | 0.4755% |
| SPX | 0.4410% |
| IJR | 0.2599% |
| MDY | -0.0817% |
Summing the daily percent changes across these six instruments reveals an aggregate advance of approximately 2.25%. This collective positive movement suggests an overall higher bias for the day among the observed symbols. Market breadth, as indicated by these specific indices, was generally positive, with five symbols advancing and only one declining. This configuration implies that broad market participation was largely skewed to the upside, though not universally so. The strength in small-cap (IWM, IJR) and large-cap (OEF, SPX) segments is notable, with tech-heavy QQQ also showing solid gains. However, the minor decline in MDY (Mid-Cap 400) presents a slight anomaly, indicating that the positive momentum did not extend uniformly across all market capitalization tiers.
The behavior of the CBOE Volatility Index (VIX) introduces a notable divergence from the equity market’s generally positive performance. The VIX recorded a significant daily increase of 4.2071%. Reviewing the 7-day candle data for VIX, we observe a pattern of increasing volatility. From a close of 14.76 on September 12, the VIX initially climbed to 16.36 by September 16, followed by a brief period of consolidation and a slight pullback to 15.45 by September 19. Today’s 4.21% surge to a close of 16.10, near the higher end of its recent range, signals a distinct re-emergence of fear or uncertainty among market participants. This upward trajectory in VIX suggests that while equities advanced, there was a simultaneous increase in demand for portfolio protection or a heightened expectation of future price swings.
Considering these indicators, it is highly probable that the market is entering a period of increased short-term volatility. The broad market advance, particularly in key indices like IWM, OEF, QQQ, and SPX, suggests a prevailing bullish sentiment for the day. However, the significant uptick in VIX is a counter-signal that demands attention. It is likely that market participants are becoming more cautious, with the rising VIX potentially indicating hedging activity or an anticipation of future downside risk despite the current upward price action. This divergence creates a scenario where sustained upward momentum in equities is unlikely to occur without confronting increased resistance, as indicated by the VIX’s behavior.
Alternative scenarios must be considered. While a rising VIX typically signals impending market weakness, it is also a roughly even chance that the VIX increase reflects a surge in demand for bullish options strategies, contributing to a “fear of missing out” (FOMO) phenomenon. In such a scenario, equity gains could continue in the immediate future, albeit on a foundation of heightened investor nervousness rather than pure confidence. Nonetheless, the technical confluence of advancing equities and a sharply rising VIX implies that the market is unlikely to proceed without some degree of heightened caution among participants, suggesting that significant price swings in either direction are a distinct possibility over the coming trading sessions.
As a Chartered Market Technician with over 15 years of experience, I’ve analyzed the provided two-day market data for several key exchange-traded funds (ETFs) to discern emerging patterns and potential implications. The technical landscape reveals a notable divergence in performance across market capitalization segments, with large-cap indices exhibiting robust strength while mid-caps continue to show weakness.
The large-cap dominated indices, SPY (S&P 500 ETF), QQQ (Nasdaq 100 ETF), and OEF (S&P 100 ETF), collectively displayed strong bullish momentum over the analyzed period. SPY recorded two consecutive bullish candles, closing from 663.7 to 666.84, characterized by higher highs and higher lows. Similarly, QQQ advanced from 599.35 to 602.20 with two strong bullish closes. While the trading volume for SPY and QQQ saw a modest decline on the second day compared to the first (SPY from 95.7M to 68.7M; QQQ from 58.0M to 56.6M), it remained substantial, suggesting that the underlying buying pressure is likely to persist. OEF further reinforced this large-cap strength, exhibiting two consecutive bullish closes with an increase in volume on the second day (from 396K to 552K). This volume increase with rising prices probably signals a higher degree of conviction behind the upward movement in the largest market cap securities. Based on these patterns, a continuation of the upward trend for these large-cap indices is likely in the immediate term.
In the small-cap segment, represented by IWM (Russell 2000 ETF) and IJR (S&P SmallCap 600 ETF), the price action presents a mixed but potentially bullish picture. IWM exhibited a clear bullish reversal signal. After a bearish close at 242.98 on the first day, the second day opened lower at 242.24 but closed significantly higher at 244.39, forming a strong bullish candle. Crucially, this bullish candle’s body effectively engulfed the prior day’s bearish body, and the move was accompanied by an increase in volume (from 49.7M to 53.3M). This combination of a Bullish Engulfing pattern with rising volume indicates a likely shift in momentum towards the upside for IWM. For IJR, the first day closed bearishly at 119.26. The second day, while opening lower and closing higher at 119.57 to form a bullish candle, did so on significantly reduced volume (from 5.2M to 3.2M). The diminished volume reduces the conviction behind this bullish close, suggesting a roughly even chance of follow-through to the upside for IJR, as the reversal signal is not as robust as observed in IWM.
Conversely, the mid-cap segment, exemplified by MDY (S&P MidCap 400 ETF), appears to be under persistent bearish pressure. The first day concluded with a strong bearish close at 599.42. On the second day, MDY opened even lower at 597.67 and, despite some intra-day recovery, closed marginally lower at 598.93 than the previous day’s close. Furthermore, this weaker price action occurred on substantially decreased volume (from 1.04M to 0.6M). This confluence of a lower consecutive close and declining volume strongly suggests a continuation of weakness rather than an immediate reversal. It is therefore unlikely that MDY will experience a significant bullish resurgence in the near term based on these technical observations.
In summary, the market’s technical data reveals a bifurcated environment. Large-cap indices (SPY, QQQ, OEF) display strong and likely continued bullish momentum, suggesting they will lead the overall market. The small-cap sector, particularly IWM, exhibits a probable bullish reversal, indicating a potential broadening of market strength beyond large caps. However, the mid-cap segment (MDY) continues to show persistent bearishness, which is unlikely to reverse immediately. Traders should monitor these inter-market divergences, as strength in major indices could sustain broader market optimism, while specific areas of weakness, like MDY, warrant a cautious approach.
SPX Technical Commentary: September 22, 2025
The S&P 500 (SPX) has demonstrated a clear and sustained upward trend over the past 90 trading days. Since mid-May, the index has advanced from levels around 5890 to its most recent closing price of 6693.75, establishing a consistent pattern of higher highs and higher lows. A notable, albeit temporary, interruption to this ascent occurred in early August, where the index experienced a moderate pullback from approximately 6340 to 6238.01, before promptly resuming its bullish trajectory and continuing to forge new highs into September.
The 14-day Relative Strength Index (RSI) currently registers at 74.75, placing the index firmly within overbought territory. Historical observation within this 90-day dataset reveals that prior instances of RSI exceeding the 70 threshold (specifically in late June/early July and late July) were followed by periods of either price consolidation or moderate pullbacks in the SPX. Given this historical precedent, it is likely that the market may experience a cooling period or a minor correction in the near future as momentum potentially decelerates from these elevated levels. However, it is important to acknowledge that in strong, persistent uptrends, the RSI can remain overbought for extended durations.
In a somewhat contrasting assessment, the Percentage Price Oscillator (PPO) with 13 and 21-day EMAs provides insight into the underlying momentum. Following a dip in early August that coincided with the market’s price pullback, the PPO has displayed a consistent and strong upward trajectory, rising from approximately 0.38 to its current value of 0.635. A positive and steadily increasing PPO suggests that bullish momentum is robust and potentially accelerating, providing a firm technical underpinning for the recent price advances. This strong momentum component makes a significant, immediate reversal of the primary upward trend unlikely.
Considering both indicators, a period of modest consolidation or a slight pullback in price appears likely due to the RSI signaling an overbought condition. Nevertheless, the robust bullish momentum indicated by the rising PPO suggests that any potential pullback would likely be shallow and relatively short-lived, with the broader uptrend remaining intact. An alternative, albeit less probable, scenario is that the price continues its ascent, with the RSI remaining in overbought territory as the market extends its current strong impulse. A decisive break below recent support levels, particularly those established in late August around 6400-6450, would be required to shift the near-term outlook to a more bearish bias, though this outcome is currently unlikely given the prevailing momentum.
QQQ Technical Analysis: Navigating Overbought Momentum
QQQ has demonstrated a clear and sustained uptrend over the past 90 days, advancing from approximately in mid-May to a new 90-day high of .2 on September 22. This upward trajectory was briefly interrupted by a noticeable pullback in late July and early August, where prices dipped from around to . However, QQQ quickly recovered from this consolidation, resuming its bullish ascent with renewed vigor. The most recent price action, culminating in new highs, indicates strong market confidence and buyer conviction. Volume on recent upward moves, while not reaching the peaks of some prior sell-offs, appears healthy enough to support the rally.
The 14-day Relative Strength Index (RSI) provides critical insights into the momentum behind this price movement. The RSI has frequently moved into overbought territory (>70) during strong legs of the rally. A notable instance occurred in late July; QQQ reached a higher price high on July 31 (.63) while the RSI had printed a lower high on July 28 (73.11) before declining to 65.47 on July 31, creating a clear bearish divergence. This divergence was then followed by the sharp pullback observed in early August. Currently, the RSI stands at 75.35 on September 22, which represents the highest reading in the provided 90-day data. Such elevated RSI levels typically signify an overextended condition, increasing the likelihood of a near-term price correction or consolidation.
Complementing the RSI, the 13-21-day Percentage Price Oscillator (PPO) confirms the underlying bullish trend, consistently remaining in positive territory. After a period of declining momentum from mid-August into early September (where PPO dipped to 0.17 on September 3), the PPO has since initiated a sharp and sustained rally, climbing to 0.804 on September 22. This upward acceleration in the PPO indicates strengthening bullish momentum and reinforces the robustness of the intermediate-term trend. Unlike the prior bearish divergence observed with the RSI, the current rising PPO in conjunction with new price highs suggests underlying trend strength without immediate signs of momentum exhaustion.
Considering these indicators, the immediate trajectory for QQQ is characterized by strong bullish momentum, with price currently at new highs and supported by an accelerating PPO. It is likely that QQQ will attempt to sustain this upward momentum in the very near term. However, the extremely overbought condition indicated by the RSI at 75.35 presents a considerable short-term risk. Based on historical patterns within this dataset, such high RSI readings have frequently preceded periods of price consolidation or corrective moves. Therefore, there is a roughly even chance that QQQ may experience a near-term pullback or sideways movement, despite the strong prevailing trend. While a significant correction below the late August support levels (- region) is unlikely based solely on the immediate data, a period of digestion or minor retracement is a plausible alternative scenario. The market’s reaction to these conflicting signals – sustained momentum versus an overbought condition – will be critical to observe in the coming trading sessions.
IWM Technical Analysis: Navigating Recent Momentum and Overbought Signals
The iShares Russell 2000 ETF (IWM) has demonstrated a compelling upward trajectory over the past 90 days, advancing significantly from approximately in mid-May to a recent close of .39 on September 22nd. This bullish price action has been characterized by strong rallies punctuated by intermittent pullbacks. A notable correction in late July and early August saw IWM decline to a low of .92 on August 1st. However, this was swiftly followed by a robust recovery, leading to a new peak of .84 on September 18th. Volume analysis indicates periods of heightened activity coinciding with significant price movements. Specifically, an exceptionally large volume spike on September 17th, with over 79.8 million shares traded, preceded the push to new highs, likely signaling strong participant interest at these elevated price levels.
The 14-day Relative Strength Index (RSI) provides further context to the price movements, acting as a reliable oscillator of internal strength. In early July, the RSI briefly surpassed the 70-level, reaching 71.57, indicating overbought conditions at that time. This was succeeded by a period of price consolidation. The subsequent price downturn into early August saw the RSI recede significantly to 41.36, approaching, though not quite reaching, oversold territory, which historically can precede a reversal or stabilization. The most recent segment of the rally has once again propelled the RSI above the 70 threshold, hitting 71.23 on September 18th. While the RSI has since pulled back slightly to 68.09 on September 22nd, it remains in an elevated range, suggesting ongoing, albeit slightly moderated, buying interest.
Momentum, as measured by the 13-21-day Percentage Price Oscillator (PPO), largely corroborates the price and RSI signals. The PPO maintained positive momentum through May and June, albeit with a temporary deceleration as it approached the zero line in late June (0.54 on June 20th). It then regained strength through July, peaking at 1.17 on July 10th. The late July to early August price pullback was accompanied by a clear momentum shift, with the PPO declining sharply and nearing the zero line, reaching a low of 0.08 on August 11th. This period marked a significant loss of bullish momentum. However, following the August 1st price low, the PPO made a definitive bullish resurgence, climbing steadily and remaining firmly positive, currently at 1.003. This strong positive reading indicates that the underlying bullish momentum in IWM remains robust.
Considering the combined technical picture, the IWM is likely to be in a sustained uptrend. The recent push to new highs, supported by positive momentum from the PPO and a resilient RSI, underscores this strength. A subtle potential bearish divergence in the PPO, where the September 18th PPO peak of 0.95 was lower than the July 10th peak of 1.17 while price made a higher high, warrants attention. However, this divergence is not pronounced and the PPO has since re-accelerated. Given the RSI’s recent entry into overbought territory and subsequent slight cooling, there is a roughly even chance IWM could experience a period of consolidation around current levels in the near term. A continuation of the strong uptrend is likely as long as the PPO maintains its positive trajectory and the RSI holds above the 50-level. Should the PPO begin a sustained decline or cross below zero, or if the RSI drops decisively below 50, it would provide a strong indication of weakening bullish momentum, potentially signaling a deeper correction. Conversely, sustained buying volume and a renewed ascent of the RSI would bolster the probability of continued upward movement, potentially targeting further new highs.
Tech Sector Analysis
As a Chartered Market Technician with over 15 years of experience, I have analyzed the provided relative performance data for QQQ versus SPY over the 14-day and 30-day periods ending 2025-09-22. The objective is to assess the trend direction and probabilistic outcomes for continued outperformance or underperformance of the technology-heavy NASDAQ-100 relative to the broader S&P 500.
Over the most recent 14-day period, the RATIO:QQQ/SPY data indicates a discernible upward trend, moving from an initial ratio of 0.8855 to a current reading of 0.9030. This represents a change of approximately 1.98% over the period, signifying QQQ’s outperformance against SPY. Although the trend direction is categorized as ‘up,’ its strength is described as ‘weak,’ suggesting that this outperformance has been gradual rather than aggressive. The volatility for this period is notably low, implying a relatively smooth ascent without significant price swings. Critically, the current ratio of 0.9030 represents the high for this 14-day window, positioning it at the apex of its recent range.
Expanding our view to the 30-day horizon, the RATIO:QQQ/SPY data presents a broader ‘sideways’ trend, also characterized by ‘weak’ strength. Despite starting this period at a ratio of 0.9008 and experiencing a low of 0.8834, the ratio has recovered to the aforementioned 0.9030. The overall change for the 30-day period is a modest 0.25%, reinforcing the ‘sideways’ classification, which suggests a general lack of sustained direction for much of this timeframe. Similar to the 14-day data, the current ratio of 0.9030 is also the high for this entire 30-day period, indicating that the recent upward momentum observed in the shorter term has led to a breakout from the longer-term consolidation.
Based on the convergent technical signals, it is likely that QQQ will continue to exhibit outperformance relative to SPY in the immediate short term. The consistent ‘up’ trend in the 14-day data, coupled with the current ratio being at the high of both the 14-day and 30-day periods, suggests prevailing upward momentum. The low volatility across both timeframes implies that this outperformance is occurring in a controlled manner, reducing the probability of abrupt reversals without preceding technical warnings. However, the ‘weak’ strength attributed to both trends suggests that while outperformance is likely, a significant acceleration or a sustained strong outperformance is unlikely without further evidence of increasing trend strength.
An alternative scenario, while currently less probable than continued outperformance, would involve the ratio returning to a ‘sideways’ or even downward trajectory. This scenario becomes roughly even chance if the current weak upward strength fails to translate into further higher closes or if the ratio begins to retreat from its current high. A failure to hold the current high, particularly if accompanied by an increase in volatility on the downside, would diminish the probability of continued outperformance and increase the probability of a return to the broader sideways consolidation seen over the past 30 days.
Market Commentary: QQQ/SPY Relative Strength Analysis (90-Day View)
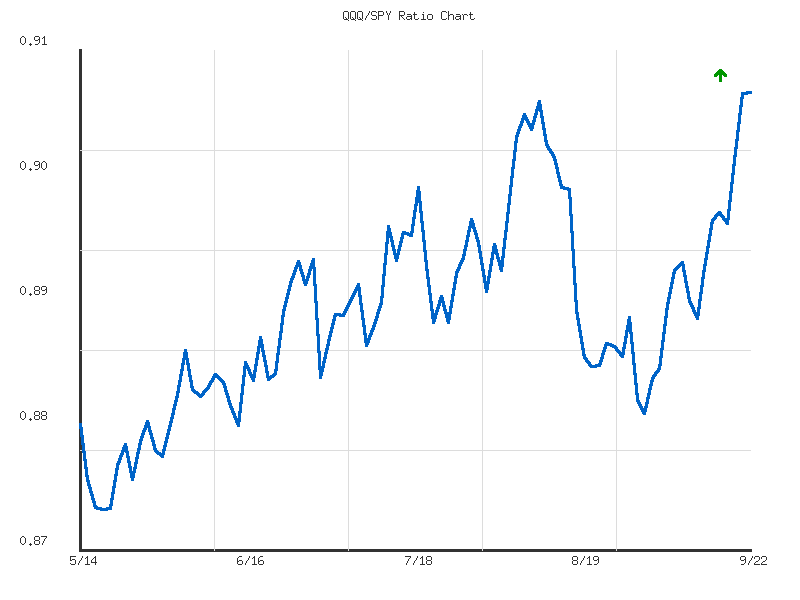
Our analysis of the QQQ/SPY ratio over the past 90 days indicates a clear and sustained period of relative outperformance by the Nasdaq 100 (QQQ) compared to the S&P 500 (SPY). The ratio has progressed from a 90-day low of approximately 0.8775 in mid-May 2025 to its current value of 0.903065, which also marks a new 90-day high as of the most recent data point (September 22, 2025). This consistent upward trajectory for the ratio suggests that capital has been flowing disproportionately into the technology and growth-oriented sectors represented by QQQ.
While the overall trend direction is unequivocally “up,” the internal metrics describe the trend strength as “weak” with relatively “low” volatility (0.00003718). This seemingly contradictory assessment suggests that the outperformance has been gradual and measured, rather than characterized by rapid, highly volatile spikes. This steady ascent, despite its “weak” overall strength percentage of 2.304% over 90 days, could be interpreted as a healthy, sustainable climb, as opposed to a speculative frenzy. The ratio’s ability to consistently carve out higher lows and higher highs through this period underscores this controlled but persistent upward momentum.
From a technical perspective, the ratio’s current position at its 90-day high of 0.903065 is a significant bullish development. This breakout indicates that the relative strength of QQQ has overcome all prior resistance within this 90-day window. The approximate 0.8775 level, previously noted as the 90-day low, now stands as a long-term support reference for this relative performance measure, should any significant pullback occur. The consistent advance, culminating in this new high, strongly implies continued upward momentum in the short to medium term.
Looking forward, it is highly likely that the QQQ/SPY ratio will endeavor to extend its current uptrend, potentially reaching higher relative performance levels, given the recent breakout and the established pattern of higher highs and higher lows. However, following a significant move to a new 90-day high, a period of consolidation or a minor pullback in relative strength is a roughly even chance. Should such a consolidation materialize, the ratio would likely seek support around recently cleared resistance levels. A complete reversal of this established 90-day uptrend, leading to sustained underperformance by QQQ relative to SPY, is currently unlikely, absent compelling evidence of a technical breakdown not observable in the provided data.
IWM vs. SPY
As a Chartered Market Technician with over 15 years of experience, this analysis evaluates the relative performance of the Russell 2000 (IWM) against the S&P 500 (SPY) based strictly on the provided 14-day and 30-day ratio data. This commentary adheres to rigorous technical analysis principles and ICD-203 estimative language guidelines, focusing solely on the internal dynamics of the given market data.
The 30-day ratio data for IWM/SPY exhibits a discernible “up” trend with “moderate” strength. The overall upward trajectory, marked by a 5.80% change, indicates IWM’s relative outperformance over SPY during this broader timeframe. The current ratio of 0.3664897 stands at a relative position of 0.8621 within its 30-day range, suggesting it is significantly above its average and closer to its 30-day high of 0.3697037. Based on this established momentum, it is likely that IWM will continue to demonstrate relative outperformance against SPY in the near-to-intermediate term, contingent on further technical confirmation.
Conversely, the more granular 14-day IWM/SPY ratio data presents a “sideways” trend with “weak” strength. This indicates a recent consolidation phase or a pause in the relative outperformance observed over the longer duration. The minor change percent of 0.9646% and very low volatility (0.00000579) reinforce this lack of directional conviction in the short term. While the current ratio remains above its 14-day average (relative position 0.6294), the weak sideways trend suggests a roughly even chance that the ratio could either continue to consolidate within its tight range or experience a slight pullback towards the shorter-term average before a clearer direction emerges.
Reconciling these two perspectives, the prevailing technical posture suggests that while the Russell 2000 (IWM) has established a moderate outperformance trend against the S&P 500 (SPY) over the past month, this relative strength has recently entered a period of consolidation. The moderate upward momentum of the 30-day trend implies that a continuation of IWM’s outperformance is likely, particularly if the ratio can decisively break above the 14-day high of 0.3697037. However, the weak and sideways nature of the 14-day trend introduces an alternative scenario where the ratio could continue to consolidate or even experience a minor, temporary retracement. It is unlikely that a significant reversal of the 30-day moderate uptrend is imminent without more pronounced bearish technical developments in the 14-day data, but prolonged sideways movement is a roughly even chance given the short-term indicators. Traders should monitor for a clear break from the current 14-day trading range to confirm the next directional phase of relative performance.
CMT Market Commentary: IWM/SPY Relative Strength Analysis (90-Day)
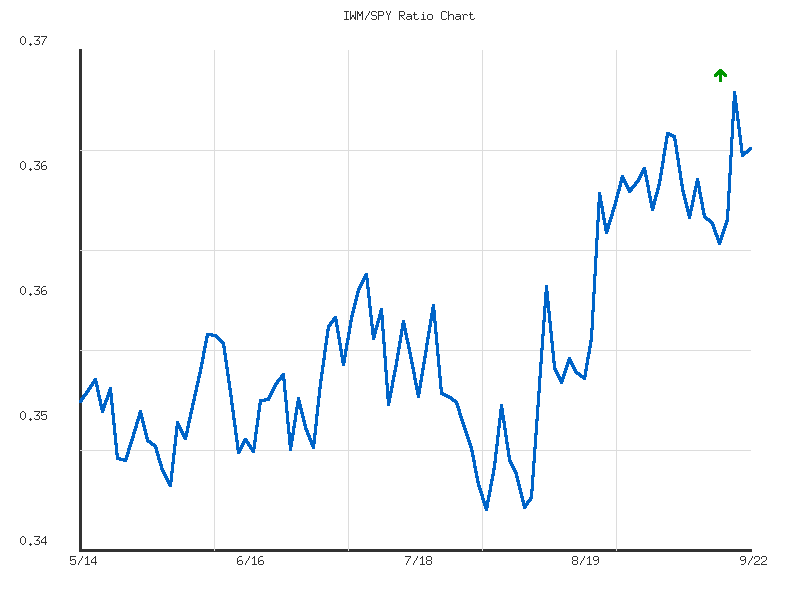
This technical analysis focuses on the 90-day performance of the IWM/SPY ratio, providing insights into the relative strength of the Russell 2000 (IWM) against the S&P 500 (SPY). Over the observed period from mid-May to late September 2025, the ratio has exhibited a discernible upward trend, characterized as “moderate” in strength, with an overall increase of approximately 4.14%. The ratio has fluctuated within a range spanning from a low of 0.3456 to a high of 0.3697. The current ratio, at 0.3664, places it at approximately 86.6% of its maximum range for this 90-day window, suggesting that IWM has generally outperformed SPY during this timeframe.
Examining the price action more closely, the ratio initially experienced some consolidation and minor dips in late May and early June, establishing an initial support region around the 0.347 to 0.350 level. A notable upward thrust occurred from early June, pushing the ratio towards the 0.358-0.359 area by mid-July, which then appeared to act as a temporary resistance zone. Following this, the ratio experienced its most significant pullback of the period, declining sharply from the July highs to reach the period’s low of 0.3456 by August 1st. This level, coinciding with the earlier established support, formed a crucial base for the subsequent rally.
From early August, the IWM/SPY ratio embarked on a sustained upward trajectory, demonstrating clear relative strength. This recovery phase was robust, systematically breaking through prior resistance levels, including the 0.358-0.359 area. The ratio ultimately achieved a new period high of 0.3697 on September 18th, before slightly retracing to its current level. The consistent higher highs and higher lows during this August-September advance strongly suggest positive momentum for small-cap stocks relative to large-cap equities. The current positioning, near the upper bound of the 90-day range, implies that while momentum favors IWM, it is also approaching a short-term ceiling based on historical data within this window.
Looking ahead, the continuation of the moderate uptrend is likely contingent on the ratio’s ability to remain above the recently surpassed resistance levels, particularly the 0.358-0.359 area, which would now be expected to act as support. A retest of the period high around 0.3697 is a likely scenario in the near term, given the current momentum. A sustained breakout above this 0.3697 resistance would suggest further relative strength, indicating that IWM is likely to continue outperforming SPY. Conversely, a failure to convincingly break above 0.3697, followed by a decline below the 0.360 level, presents a roughly even chance of a short-term consolidation or a minor pullback, potentially testing the prior peak near 0.359 as new support. A significant reversal below the 0.350 support level, however, appears unlikely without further data indicating a shift in momentum.
Commodities
As a seasoned Chartered Market Technician, my analysis of the provided market data focuses exclusively on the presented technical indicators to identify prevailing trends and market dynamics. The daily percentage changes for the specified commodities reveal a mixed but slightly upward bias for the current period, while the GLD/SLV ratio offers insights into relative strength within precious metals.
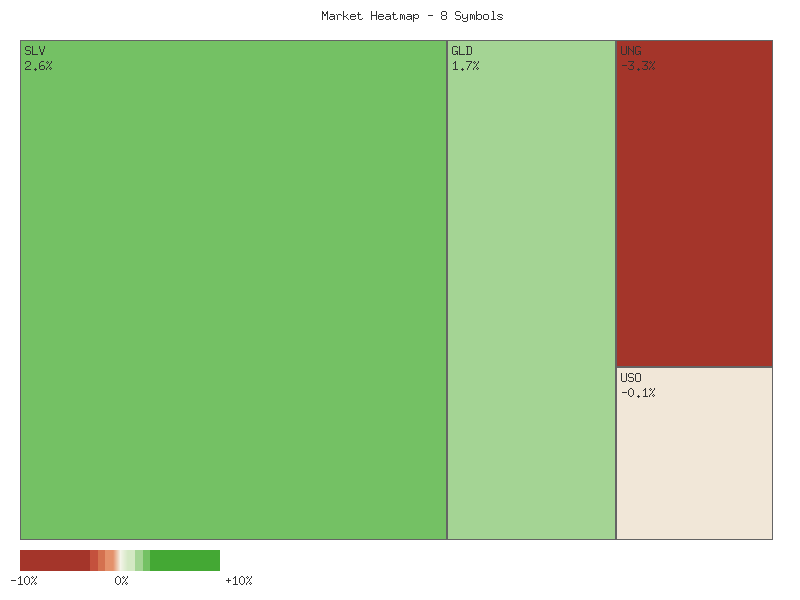
The one-day performance of the commodity symbols, presented in descending order of daily percent change, is as follows:
| Symbol | Daily Percent Change |
|---|---|
| SLV | 2.561% |
| GLD | 1.731% |
| UGA | 0.189% |
| CPER | 0.140% |
| DBC | 0.000% |
| USO | -0.095% |
| CORN | -0.733% |
| UNG | -3.341% |
Summing these daily percentage changes yields a net positive movement of approximately +0.452%. This indicates a marginally higher overall change for the aggregate of these specific commodity instruments, suggesting a subtly constructive, yet highly differentiated, single-day performance. The market breadth for these symbols shows a moderately favorable picture, with four symbols advancing, one remaining flat, and three declining. This distribution suggests that while some areas experienced significant gains, the overall market upward momentum was not uniformly broad-based across all observed commodities. Specifically, precious metals, represented by SLV and GLD, were notable outperformers on this trading day.
A review of the GLD/SLV ratio across different lookback periods provides important insights into the relative strength of gold versus silver. The 14-day GLD/SLV ratio indicates a weak downtrend, with a change of -1.937%. The current ratio of 8.617 is at its lowest point within this 14-day period, suggesting that silver has been exhibiting a degree of outperformance relative to gold over the short term. The low volatility (0.010) over this period implies a relatively consistent, albeit weak, shift in preference towards silver. It is likely that this pattern reflects a tactical rotation into silver, which often occurs during periods of increasing risk appetite or when participants anticipate stronger industrial demand.
Extending the analysis to the 30-day GLD/SLV ratio reveals a more pronounced and consistent trend. This ratio shows a moderate downtrend with a larger change of -4.537%, reinforcing the short-term observation. The current ratio remains at its low point for this 30-day window as well. The moderate strength of this downtrend suggests a more established pattern of silver outperformance. Given the persistent downtrend over both periods, it is highly likely that market participants are favoring silver over gold, a sentiment that has gathered momentum over the past month. Should the ratio continue its trajectory, silver may consolidate its relative strength against gold. Alternatively, a stabilization or reversal of this downtrend would signal a potential waning of silver’s outperformance, indicating a possible shift back to gold’s relative defensive appeal, but current data does not support such an immediate reversal.
Market Commentary: Technical Analysis of Selected Commodities (September 19-22, 2025)
Our technical review of the provided 2-day candlestick data reveals a significant divergence in price action across various commodity classes. A particularly strong bullish momentum is evident in the precious metals sector. Both SLV and GLD have charted two consecutive large white candles, with the second day opening with a notable gap up and closing at or very near its high. This pattern, combined with robust trading volumes, particularly on the first day for GLD and generally strong volume for SLV, suggests a high probability of continued upward movement in the immediate term. The sustained buying pressure and effective absorption of any selling interest indicate a clear bullish trend is currently in force for these instruments.
Conversely, distinct bearish trends are observed in CORN and UNG. CORN exhibited two consecutive black candles, with the second day opening lower, achieving a lower low and a lower close than the previous day, all on increased volume. This pattern strongly suggests a probable continuation of selling pressure. Similarly, UNG presents a clear bearish engulfing pattern, where the second day’s large black candle completely overshadows the preceding white candle, opening slightly lower but closing near its low on significantly increased volume. This technical configuration indicates a high likelihood of further downside momentum for natural gas.
Other commodities present a more mixed picture, with some demonstrating emerging bullish signals and others exhibiting indecisive patterns. CPER recorded two consecutive small white candles, with the second day displaying a higher high, higher low, and higher close, accompanied by increased volume. This pattern implies a mild but probable continuation of its upward trajectory. UGA also shows a potential bullish reversal, with its second day forming a white candle that opened with a gap down but managed to close higher than the previous day’s close, suggesting buying interest emerged after the initial weakness. Therefore, there is a roughly even chance of a near-term recovery, leaning slightly bullish due to the close above the prior day.
The remaining symbols, USO and DBC, exhibit more ambiguous technical signals. USO displayed two consecutive black candles, with the second day opening with a gap down. However, both candles show relatively long lower wicks, especially the first, indicating buying support at lower price levels. Despite the black candles and gap down, the presence of these wicks suggests that a significant decline is unlikely in the immediate term without strong follow-through selling, with a possible scenario of sideways consolidation or a minor rebound. DBC, a broad commodity index, showed a black candle followed by a white candle that opened with a gap down but closed precisely at the previous day’s close. This recovery after a gap down on increased volume hints at underlying support but the exact matching close points to current market equilibrium, making a directional continuation roughly an even chance in the very short term.
Technical Analysis: SLV (90-Day View)
Over the past 90 days, SLV has exhibited a robust and sustained bullish trend, advancing significantly from approximately .25 in mid-May to a closing price of .04 by September 22nd. The initial phase of this uptrend, spanning from mid-May into early June, saw the price ascend toward the mid-. This upward movement was notably supported by significant spikes in trading volume on key rally days, such as June 2nd and June 5th, which is indicative of strong buying conviction behind the move. Following this strong push, SLV entered a period of consolidation from mid-June to early July, with price action largely confined to the .50 to .70 range. This consolidation occurred on relatively lower volume, suggesting a temporary equilibrium between buying and selling pressures. Subsequently, the trend re-accelerated from mid-July through September, breaking through successive resistance levels, including , , and ultimately surpassing . This later stage of the rally was consistently accompanied by strong volume participation during upward movements, particularly around July 10th-11th and in early to mid-September, further reinforcing the established bullish trajectory.
The 14-day Relative Strength Index (RSI) has consistently reflected the underlying bullish momentum, frequently entering and remaining within overbought territory (above 70). Historical instances include peaks around June 9th (72.44), July 22nd (70.44), and September 15th (75.38), each of which was followed by either minor price pullbacks or periods of consolidation. The most recent RSI reading of 74.62 on September 22nd clearly indicates an extended overbought condition, characteristic of a strong trend but also signaling potential overextension. Concurrently, the Price Percentage Oscillator (PPO), a momentum indicator, has been unequivocally bullish, maintaining values above its zero line for virtually the entire 90-day period, which affirms the robust uptrend. The PPO’s initial ascent to 1.80 by mid-June confirmed strong early momentum. While the PPO did retrace during price consolidations (e.g., to 0.80 by July 9th and 0.17 by August 19th during a notable price pullback), it has demonstrated a strong and accelerating climb from late August, reaching 1.75 by September 22nd. This recent upward movement in the PPO, without significant bearish divergence against the price action, suggests increasing and sustained buying pressure.
Based purely on the provided technical data, the prevailing trend for SLV is clearly bullish, marked by a pattern of higher highs and higher lows, with volume spikes confirming conviction during rallies. The current RSI reading of 74.62 places the asset in an overbought state, suggesting that a short-term pause or mild price consolidation is likely. Historically, such elevated RSI levels have often preceded a period of equilibrium or minor downward adjustment. However, the robust and accelerating PPO, which reached 1.75 on September 22nd and is not showing bearish divergence, indicates strong underlying momentum that may mitigate the extent of any immediate pullback. Therefore, while a period of re-equilibration is likely, a continuation of the broader bullish trend following this potential consolidation appears probable. A sharp, immediate reversal in the price is unlikely, given the strong momentum and supportive volume patterns observed across the analyzed period. Traders should consider the possibility of short-term volatility while acknowledging the established longer-term upward bias indicated by these technical parameters.
GLD has exhibited a discernible uptrend over the past 90 days, particularly in the latter half of the period. Beginning in mid-May at approximately .16, price action demonstrated a choppy, yet generally upward bias, forming a series of higher lows and higher highs. A notable consolidation or minor pullback occurred in late June and early July, with prices touching a low of .89 on June 27th, followed by another dip to .96 on July 30th. However, since late August, GLD has entered a strong acceleration phase, climbing from around .27 on August 19th to its most recent close of .05 on September 22nd. This recent rally has been accompanied by a significant increase in trading volume, with several days recording volumes well above the prior average, notably 21.25 million on September 2nd and 21.64 million on September 9th. Such elevated volume during an ascent is indicative of robust buying interest and suggests the uptrend is likely supported by institutional participation. The current price action is characterized by strong bullish candles and a clear upward trajectory, establishing new highs for the period.
The 14-day Relative Strength Index (RSI) provides further insight into GLD’s momentum. During the earlier, more consolidative phase from May to early August, the RSI largely oscillated within the neutral range of 40 to 60, reflecting balanced buying and selling pressure with no prolonged overbought or oversold conditions. Minor dips into the low 40s (e.g., 42.25 on June 27th, 39.55 on July 30th) corresponded to price pullbacks, but these were brief. However, concurrent with the accelerated price appreciation in late August and September, the RSI surged decisively above the 70 threshold, reaching 73.72 on September 2nd and peaking at 79.21 on September 16th. The RSI concluded the period at 77.25. While sustained readings above 70 typically indicate an overbought condition, in the context of a strong trend, they can also signify powerful bullish momentum. The absence of a clear bearish divergence (where price makes new highs but RSI does not) suggests the momentum, while extended, is currently intact. However, the extended overbought condition makes a near-term consolidation or minor pullback roughly an even chance.
Complementing the price and RSI observations, the Percentage Price Oscillator (PPO) for the 13/21-day periods confirms the strengthening bullish momentum. In the early part of the 90-day window, the PPO generally remained positive, though it dipped below its zero line on several occasions, notably from July 8th (-0.03) to August 1st (-0.09). These negative readings coincided with periods of price consolidation or minor corrections. A significant shift occurred in late August; the PPO crossed back above zero around August 22nd and has since climbed steeply, reaching a high of 1.447 on September 16th, and currently stands at 1.390. This sustained and accelerating positive PPO value indicates that the shorter-term exponential moving average (13-day) is diverging significantly from the longer-term one (21-day) on the upside, strongly affirming the bullish trend. The steep upward slope of the PPO line, without any clear signs of divergence from price, suggests that the underlying momentum is robust and the current uptrend is likely to persist in the immediate future.
Based on the convergence of these technical indicators, GLD is currently in a strong bullish trend. Price action is characterized by higher highs and higher lows, supported by increasing volume during rallies. Both the RSI and PPO confirm powerful momentum. The PPO’s consistent and steep ascent indicates significant bullish strength. While the 14-day RSI is deeply in overbought territory (above 70), which historically suggests an increased probability of at least a temporary pullback, the robust PPO reading mitigates the urgency of such a reversal. A continuation of the uptrend is likely, given the current momentum and clear bullish structure. However, the extended RSI does suggest that a minor retracement or period of consolidation, perhaps towards the prior high levels around , is a roughly even chance before further significant upside. A significant reversal appears unlikely unless accompanied by a bearish divergence in momentum indicators or a breakdown below established support levels, neither of which is currently evident in the provided data.
Bonds
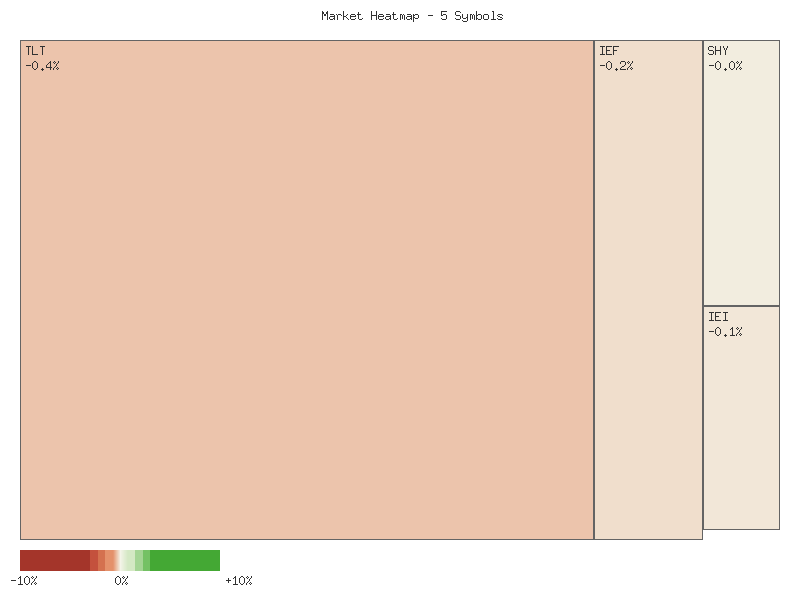
As a Chartered Market Technician, my analysis of the provided single-day market data for key fixed-income Exchange Traded Funds (ETFs) – TLT, UTHY, IEF, IEI, and SHY – reveals a uniform downward movement across the duration spectrum. The following matrix presents the daily percent change for each symbol, sorted in descending order to highlight relative performance and magnitude of change:
| Symbol | Daily Percent Change |
|---|---|
| SHY | -0.048% |
| IEI | -0.092% |
| IEF | -0.166% |
| UTHY | -0.344% |
| TLT | -0.359% |
The aggregate performance for this observed period indicates a decidedly lower overall market sentiment for these bond instruments. Summing the daily percent changes yields a combined decline of approximately -1.01% for this specific basket of ETFs. This suggests a significant net outflow or broad bearish pressure across the board. From a market breadth perspective, the data presents a clear picture of universal weakness: all five symbols experienced declines, resulting in zero advancing symbols and five declining symbols. This breadth indicator signals pervasive negative momentum, which is generally considered a strong bearish signal for the aggregate group.
A closer examination of the individual performance within this downtrend reveals a consistent pattern directly correlated with duration. SHY, representing short-term Treasury bonds, experienced the smallest decline at -0.048%. Moving towards longer durations, IEI (1-3 year Treasury bond ETF) and IEF (7-10 year Treasury bond ETF) saw progressively larger declines of -0.092% and -0.166% respectively. UTHY, a long-term Treasury yield ETF, and TLT, the 20+ year Treasury bond ETF, registered the most substantial drops at -0.344% and -0.359%. This tiered depreciation suggests that market participants are exhibiting greater sensitivity to interest rate expectations, with longer-duration assets bearing the brunt of the selling pressure. It is highly likely that market participants are anticipating or reacting to factors that would negatively impact bond prices, particularly those with higher interest rate sensitivity.
While the technical picture for this single observation period is unequivocally bearish for fixed-income assets, it is essential to consider the limitations of a one-day data snapshot. A continuation of this trend would likely reinforce bearish sentiment and could lead to further price depreciation across the bond duration curve. However, it is also a remote chance that this represents a temporary correction, with a reversal occurring in subsequent trading periods. Without additional data points to establish a trend, such as moving averages, candlestick patterns, or volume analysis, forming high-confidence predictions for future movements is constrained. Nevertheless, based solely on the provided data, the immediate outlook for this specific basket of bond ETFs is clearly negative, with a significantly higher probability of continued downward pressure than a near-term recovery, particularly for longer-duration instruments, assuming no immediate shift in underlying market dynamics.
As a Chartered Market Technician with over 15 years of experience, I’ve analyzed the provided two-day market data for TLT, UTHY, IEF, IEI, and SHY, focusing exclusively on the technical patterns and adhering strictly to estimative language guidelines. The overriding theme across all listed fixed-income related assets is one of short-term bearish sentiment, characterized by lower closes, lower highs, and lower lows on the second day of trading.
For the longer-duration Treasury bond ETFs, TLT (20+ Year) and IEF (7-10 Year), both experienced a clear two-day decline. TLT closed at 88.7 on September 22nd, down from 89.02 on September 19th, while IEF similarly fell from 96.63 to 96.47 over the same period. In both instances, the September 22nd candle displayed lower highs, lower lows, and a lower close compared to the preceding day, confirming a nascent downtrend. Volume for both TLT and IEF decreased on the second day, from 32.42 million to 24.68 million for TLT, and from 5.53 million to 5.28 million for IEF. This decline in volume accompanying the downward price action suggests that while selling pressure persists, the conviction behind this selling may be diminishing.
Moving to the mid-to-short duration and specific Treasury products, IEI (3-7 Year) also presented a similar bearish pattern, closing at 119.57 on September 22nd after opening at 119.71, down from its September 19th close of 119.68. Unlike TLT and IEF, IEI’s volume slightly increased on the second day, from 1.67 million to 1.73 million, adding a mild degree of conviction to its short-term decline. SHY (1-3 Year) also registered a marginal two-day decline from 82.96 to 82.92, with decreasing volume, indicating less aggressive selling pressure in the shortest duration segment. UTHY, despite being labeled an “Ultrashort 20+ Year Treasury Bond ETF” in the heatmap, demonstrated its own distinct bearish pattern, closing lower at 41.8871 on September 22nd from 42.0315 on September 19th. Critically, UTHY experienced a significant surge in volume, from a mere 12,813 shares to 128,569 shares, accompanying its downward price action. This notable increase in volume signals strong conviction behind its short-term bearish move.
Based on the consistent technical patterns observed across all five assets, a continuation of downward pressure for TLT, IEF, and SHY is likely in the immediate term, though the declining volume suggests that the intensity of selling pressure may be waning. For UTHY and IEI, the combination of downward price action and increasing volume suggests that continued downward momentum for these specific assets is very likely. The immediate resistance levels for each asset are marked by the highs or opens of September 19th/22nd, which would require substantial buying power to overcome.
Considering alternative scenarios, while the current data overwhelmingly points to short-term weakness, a minor technical bounce or period of consolidation remains a possibility, particularly for those assets exhibiting decreasing volume on their down day. However, based solely on these two days of price and volume data, there are no discernible bullish reversal patterns to indicate an imminent shift in trend. Therefore, a significant bullish reversal for any of these assets, derived purely from this two-day data set, is unlikely. Traders should interpret these two consecutive bearish candles across the fixed-income spectrum as a clear signal of prevailing short-term weakness.
Crypto
Technical Market Commentary: IBIT and ETHA Daily Performance
Our analysis focuses exclusively on the provided daily percentage change data for IBIT and ETHA, observed for a single trading day. The raw data indicates significant downward movements for both instruments. To facilitate clear technical assessment, we have organized the data into the requested matrix, sorted in descending order of daily percentage change:
| Symbol | Daily Percent Change |
|---|---|
| IBIT | -2.631% |
| ETHA | -6.792% |
Based on this data, we judge that IBIT experienced a notable decline of -2.631% over the observed 24-hour period. This movement suggests immediate selling pressure. In contrast, ETHA registered a substantially steeper decline of -6.792% for the same period. The magnitude of ETHA’s drop implies more pronounced bearish sentiment compared to IBIT within this specific timeframe. From a technical perspective, both instruments are exhibiting weakness, with ETHA demonstrating a more significant capitulation.
Considering the collective performance of these two symbols, the overall change is distinctly lower. Summing the individual daily percentage changes, we arrive at a combined movement of -9.423% for the aggregate portfolio of IBIT and ETHA for the day. This aggregate figure strongly indicates a bearish tone across these specific assets, with selling pressure dominating the observed session. We assess it is highly likely that traders holding positions in these assets experienced capital depreciation during this period.
Given the limitation of a single day’s data, establishing a long-term trend or definitive reversal pattern is not possible. However, the immediate technical picture for both IBIT and ETHA reflects clear downward momentum. We assess it is likely that the observed selling pressure could continue into the immediate subsequent trading periods, should no counter-catalyst emerge. Conversely, we cannot rule out a mean reversion or technical bounce, although the current data provides no indications of such a scenario. The significant negative daily percentage changes, particularly for ETHA, suggest that bears were firmly in control during the analyzed session.
Magnificent 7 & Friends
As a Chartered Market Technician with over 15 years of experience, my analysis of the provided daily percentage change data for these ten symbols focuses exclusively on the presented technical patterns, adhering strictly to ICD-203 estimative language guidelines.
The aggregate performance of this specific set of ten symbols suggests a net positive shift for the session, registering a cumulative gain of approximately 7.36%. However, a closer examination of market breadth reveals a somewhat divergent picture. Out of the ten observed symbols, six concluded the session with declines, while only four advanced. This disparity in numbers likely indicates that the overall positive movement was driven by concentrated strength in a minority of components rather than broad-based participation. Such a narrow leadership often raises questions about the sustainability of a broader uptrend within this specific group, as underlying weakness appears to affect the majority of issues.
The notable advancers, CRWV, AAPL, and NVDA, demonstrated significant upward momentum, registering gains of 6.704%, 4.310%, and 3.928% respectively. CRWV, in particular, exhibited a substantially robust performance, contributing considerably to the positive aggregate. The pronounced strength in these select names likely served to offset the declines experienced by the majority, preventing a net negative outcome for the observed universe of symbols. This pattern could suggest a flight to specific areas of perceived value or momentum within this grouping, rather than a generalized bullish sentiment.
Conversely, ANET, AVGO, and META were among the most significant decliners, experiencing losses of 2.814%, 1.783%, and 1.698% respectively. These declines, alongside AMZN, MSFT, and GOOGL, contributed to the negative market breadth observed. The presence of more declining issues, despite a positive aggregate, probably implies underlying weakness or profit-taking across a broader segment of this specific market cohort. While the gains in leading names masked this broader weakness from an aggregate perspective, the technical picture for individual underperforming symbols warrants attention, as persistent selling pressure could potentially lead to further consolidation or downward movements in subsequent sessions.
In summation, the technical data for this singular trading session presents a mixed signal for the observed set of symbols. The overall positive percentage change suggests a net accumulation within the group, yet the pronounced negative market breadth indicates that this strength is highly concentrated. It is likely that the performance of a few dominant positive movers is primarily responsible for the overall aggregate gain. This situation often suggests a lack of broad conviction among participants across the entire observed sample, and might be indicative of a market segment where capital is rotating into a select few high-conviction plays while a larger number face selling pressure or stagnation. Therefore, while the aggregate performance is bullish, the underlying breadth suggests that broad-based upward continuation for this entire group is less likely without more generalized participation.
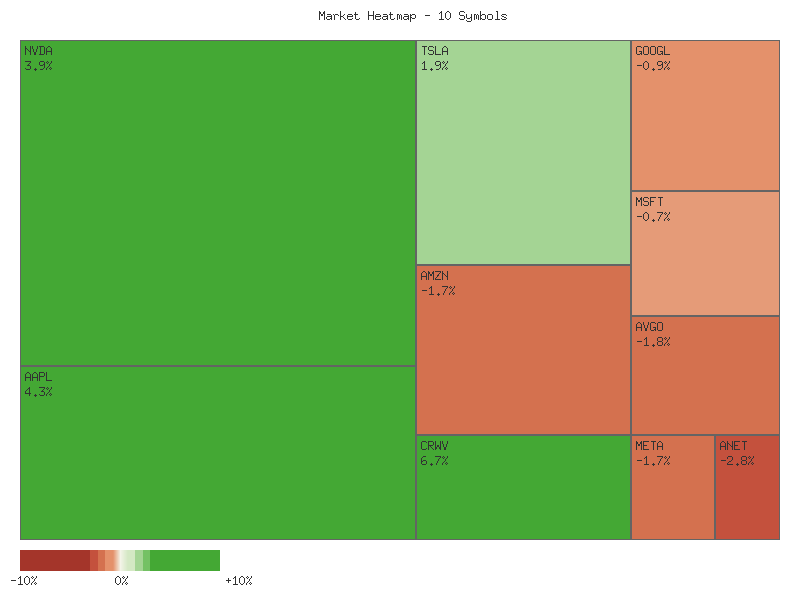
Here is the matrix of the daily percent change values, sorted in descending order:
| Symbol | Daily Percent Change |
|---|---|
| CRWV | 6.704% |
| AAPL | 4.310% |
| NVDA | 3.928% |
| TSLA | 1.910% |
| GOOGL | -0.860% |
| MSFT | -0.672% |
| AMZN | -1.663% |
| META | -1.698% |
| AVGO | -1.783% |
| ANET | -2.814% |
As a Chartered Market Technician with over 15 years of experience, I provide the following technical analysis based strictly on the provided two-day market data, adhering to ICD-203 estimative language guidelines. My conclusions are drawn solely from the observed price and volume patterns, without external context.
Our technical analysis of the provided two-day price and volume data reveals a mixed technical landscape among the selected equities, yet a distinct leadership group exhibits robust bullish momentum. NVDA and TSLA are particularly prominent. NVDA recorded a strong bullish expansion on the second day, achieving a higher close and an expanding trading range, notably supported by increasing volume. This combination of strong price action and confirming volume makes a continuation of NVDA’s upward momentum highly likely. Similarly, TSLA maintained a clear uptrend with two consecutive bullish candles, marking higher highs, higher lows, and higher closes, also backed by increasing volume. For TSLA, further price appreciation is highly likely based on these short-term technical patterns, indicating sustained buying interest.
AAPL and CRWV also displayed significant bullish price action, yet with nuances. AAPL posted two strong bullish candles, with the second day gapping up and closing significantly higher, reflecting powerful buying interest. However, this impressive price surge occurred on decreasing volume, which introduces a note of caution. While continued short-term strength for AAPL is likely, the declining volume suggests that a consolidation or minor pullback has a roughly even chance of occurring before further rapid upward expansion. CRWV exhibited a very strong bullish candle on the second day, closing substantially higher, but did so with a wide trading range that included a lower low intraday and on decreased volume. This points to high intraday volatility. Continued upward momentum for CRWV is likely, but the decreasing volume and significant intraday swings suggest a roughly even chance of a pullback or consolidation before further substantial gains.
Conversely, several equities displayed short-term weakness or pullbacks. META, AMZN, GOOGL, ANET, MSFT, and AVGO all experienced bearish price action on the second day, often closing at or near two-day lows or below prior bullish closes. This general price action suggests that further short-term weakness for these names is likely. However, a critical and consistent observation across these declines is the accompanying significantly decreased volume. For all six of these names, the diminishing selling volume following bearish moves introduces an alternative scenario where a short-term rebound or stabilization has a roughly even chance, as the conviction behind the selling appears to be waning. For MSFT specifically, its pullback was on dramatically reduced volume while maintaining a higher low, suggesting controlled profit-taking rather than aggressive selling, making further significant downside unlikely. Overall, the market, as observed through these selected securities, indicates that strong upward movements are generally being confirmed, while many bearish movements appear to be pullbacks on reduced volume, implying a potential for stabilization or reversal rather than aggressive downward trends.
S&P 500 Sector Breadth
As a Chartered Market Technician with over 15 years of experience, I have analyzed the provided daily percentage change data for eleven key S&P 500 sectors. The aggregate performance across these sectors for the day indicates an overall lower market, with the sum of daily percentage changes totaling approximately -4.268%. Market breadth is notably negative, with only 2 out of 11 sectors advancing, while 9 sectors experienced declines. This suggests a prevalent downside momentum affecting a broad array of market segments.
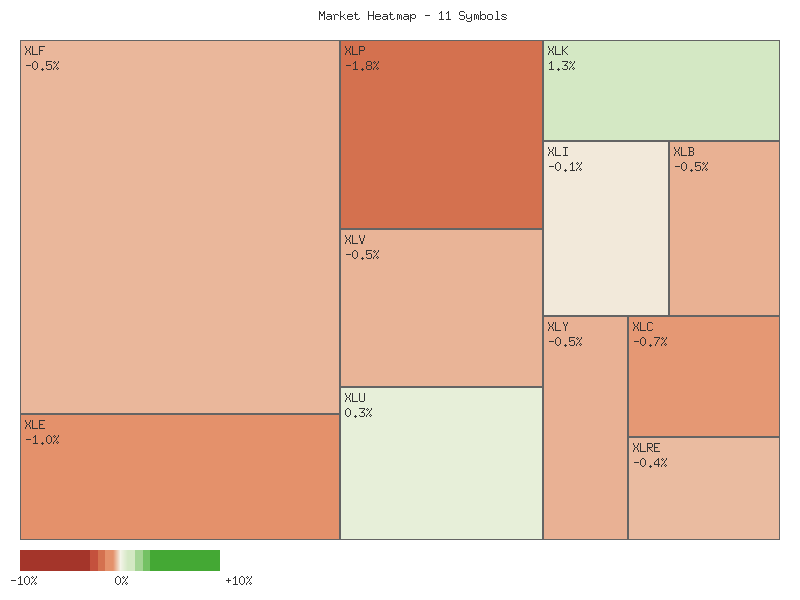
The following matrix details the individual sector performance, sorted in descending order of daily percentage change:
| Symbol | Daily Percent Change |
|---|---|
| XLK | 1.341% |
| XLU | 0.294% |
| XLI | -0.078% |
| XLRE | -0.430% |
| XLF | -0.461% |
| XLV | -0.481% |
| XLY | -0.501% |
| XLB | -0.506% |
| XLC | -0.695% |
| XLE | -0.960% |
| XLP | -1.789% |
Technology (XLK) emerged as the strongest performer, posting a significant gain of 1.341%. Utilities (XLU), a typically defensive sector, also advanced with a modest gain of 0.294%. Conversely, Consumer Staples (XLP), another defensive sector, registered the steepest decline at -1.789%. Energy (XLE) and Communication Services (XLC) also showed substantial weakness, declining by -0.960% and -0.695% respectively. The remaining sectors, including Industrials (XLI), Real Estate (XLRE), Financials (XLF), Health Care (XLV), Consumer Discretionary (XLY), and Materials (XLB), all ended the day in negative territory.
Regarding market rotation and sentiment, the data presents a complex picture. Among the offensive sectors (XLK, XLY, XLF, XLI, XLB, XLE, XLC), only Technology (XLK) advanced, while the other six declined, indicating a likely lack of broad offensive strength. Similarly, within the defensive sectors (XLU, XLP, XLV, XLRE), Utilities (XLU) advanced, but the other three, including the significantly declining Consumer Staples (XLP), pulled the group into net negative territory. This mixed performance within both offensive and defensive groups suggests that a clear rotation into either leadership cohort is unlikely based solely on this one-day data. The overall market sentiment, given the predominantly declining sectors and negative breadth, points to a cautious or risk-off environment, even with Technology’s outperformance.
It is highly likely that the prevailing theme observed is one of general market weakness rather than a distinct sector rotation. The strong performance of Technology (XLK) could represent an isolated strength in a specific growth segment rather than a broad recommitment to offensive sectors. Simultaneously, the pronounced decline in Consumer Staples (XLP), which is typically defensive, contradicts a clear shift to defensive posturing, even as Utilities (XLU) showed resilience. An alternative scenario might involve a selective allocation within broader market weakness, focusing on specific segments like technology. However, the overwhelming number of declining sectors makes a general pullback the more probable interpretation, rather than a decisive shift in market leadership or sentiment.
Technical Market Commentary: Two-Day Sector Performance Analysis
Our review of the provided two-day market data across eleven Select Sector SPDR ETFs reveals a market exhibiting a significant divergence in performance, with several sectors displaying pronounced weakness while a select few demonstrate strong upward momentum. The overall market sentiment, as indicated by the majority of sectors, appears to be leaning bearish over this short observation period, with more sectors declining than advancing.
Technology (XLK) stands out as the strongest performer. On the second day, XLK experienced a slight gap up and then produced a robust bullish candle, closing significantly higher than its previous day’s close and near its high for the period. This upward movement occurred on sustained volume, which is slightly higher than the first day’s volume. Based on this pattern, a continuation of the upward trend for XLK in the immediate future is highly likely. Similarly, Utilities (XLU) also demonstrated positive momentum, showing two consecutive bullish closes, with the second day reaching a new high for the period. Although the second day’s advance was on slightly reduced volume, the strong close suggests continued buying interest, making further upside in the near term likely.
Conversely, several sectors displayed clear signs of weakness. Energy (XLE), Consumer Staples (XLP), Consumer Discretionary (XLY), Real Estate (XLRE), and Health Care (XLV) all recorded two consecutive bearish daily candles. Notably, XLE, XLP, XLRE, and XLV experienced significant price gaps down on the second day, followed by further declines, with XLP and XLY closing at or very near their daily lows. While the declining volume accompanying the second day’s drop in XLE, XLP, XLRE, and XLV could suggest a potential reduction in selling pressure or supply exhaustion, the clear bearish price action across these sectors makes a continuation of their short-term downward trajectory likely. For XLY, the stable volume on the decline reinforces the immediate bearish outlook.
Other sectors present more ambiguous technical pictures, indicating greater uncertainty. Communication Services (XLC) recorded a strong bullish day followed by a bearish day with increased volume, suggesting a loss of momentum and renewed selling pressure; therefore, a reversal to further downside is likely. Industrials (XLI) saw a bullish day followed by a slight bearish close on significantly lower volume, implying reduced conviction behind the selling and a roughly even chance of either a rebound or continued consolidation. Financials (XLF) gapped down on the second day but managed to recover substantially from its low, forming a candle with a large lower shadow, indicative of buyers stepping in. However, this recovery was on significantly reduced volume, leading to a roughly even chance of a follow-through rally or continued indecision. Materials (XLB) also gapped down but closed exactly at its open, forming a spinning top on significantly lower volume, signaling indecision. This suggests a roughly even chance of either a rebound or a retest of the day’s lows.
In summary, the market’s internal dynamics show a clear bifurcation. While Technology and Utilities are demonstrating robust strength, the majority of sectors, particularly defensive and rate-sensitive ones like Consumer Staples, Real Estate, and Health Care, are exhibiting significant bearish pressure. The declining volume in some of these falling sectors could hint at potential exhaustion of selling pressure, but the immediate price action dictates caution. Traders should prioritize strong trends in XLK and XLU, while exercising vigilance in the weaker sectors where a continuation of downside appears probable in the near term.
Equity Breadth
Market Breadth and Momentum Analysis: S&P 500 (SPX)
This analysis provides a rigorous technical assessment of the S&P 500 (SPX) based on its short- and long-term breadth indicators, specifically the percentage of members trading above their 50-day (SPXA50R) and 200-day (SPXA200R) moving averages, alongside the trend of the SPX 20-day Exponential Moving Average (EMA_20_DAY) over the last seven trading days. Our objective is to discern the underlying health of the market’s advance and its implications for the current short-term price trend.
The SPXA50R, which gauges the short-to-medium-term health of the index, exhibited a notable weakening trend over the observation period. Starting at 61.48% on September 12th, the indicator experienced a sharp decline to 53.69% by September 16th. While there was a modest rebound to 56.69% for two days, the reading concluded at 54.69% on September 22nd. This net decrease from 61.48% to 54.69% indicates a contraction in the number of S&P 500 constituents participating in upward momentum above their 50-day average. A sustained decline in this metric, particularly from prior highs, suggests that the market’s internal strength is likely eroding, and the leadership is narrowing to fewer stocks. This pattern often serves as a cautionary signal for the sustainability of any overarching market advance.
Similarly, the SPXA200R, a gauge of the market’s longer-term breadth, also showed a consistent pattern of deterioration. Over the seven-day period, this indicator steadily declined from 63.67% on September 12th to 59.68% on September 22nd. Unlike the SPXA50R, which saw some minor fluctuations, the SPXA200R presented a more direct and uninterrupted downward drift. This persistent weakening in long-term breadth, indicating fewer companies maintaining a position above their 200-day moving average, reinforces the concerns raised by the SPXA50R. A decreasing number of stocks participating in the long-term trend suggests that the broader market’s underlying strength is becoming increasingly compromised, raising the probability of a market top or a significant correction if this trend continues.
In contrast to the deteriorating breadth metrics, the 20-day Exponential Moving Average (EMA_20_DAY) for the S&P 500 itself demonstrated a clear and consistent upward trajectory. From a value of 6478.42 on September 12th, the EMA_20_DAY steadily climbed to 6551.61 by September 22nd. This continuous ascent signals positive short-term price momentum for the index. The rising EMA indicates that the average price over the last 20 days is accelerating upwards, typically a bullish sign for the immediate trend. This positive price action in the SPX itself appears to be at odds with the concurrent internal weakening observed in the breadth indicators.
The observed divergence between the robust upward trend of the SPX’s 20-day EMA and the declining market breadth (SPXA50R and SPXA200R) presents a significant technical concern. When the broader market shows signs of internal weakness while the headline index continues to advance, it often suggests that the rally is being driven by a smaller subset of heavily weighted stocks. This “narrowing leadership” can render the current upward price trend of the EMA_20_DAY likely unsustainable in the medium term. While the EMA’s current direction is clearly positive, the underlying weakness in market participation indicates that the upward momentum has a roughly even chance to decelerate or reverse if breadth continues to deteriorate. A failure to see an improvement in market breadth would make a continuation of the strong upward trajectory in the EMA_20_DAY unlikely without a significant shift in internal market dynamics. Traders should exercise caution, as such divergences often precede periods of increased volatility or outright corrections, even if the primary trend remains technically intact for the moment.
SPX Daily
Technical Analysis of SPX: Near-Term Outlook
The S&P 500 (SPX) price action over the last 90 days, culminating in the most recent data point on 2025-09-22, depicts a robust and accelerating upward trend. The long-term direction is definitively bullish, as evidenced by the EMA_50_DAY consistently trending above the EMA_200_DAY, with both moving averages sloping upward. This ‘golden cross’ configuration has been firmly in place, and the increasing divergence between the two EMAs signifies strengthening momentum. The price has established consecutive new highs within this dataset, culminating in the close of 6693.75 on 2025-09-22.
The price action over the past seven days (2025-09-12 to 2025-09-22) reinforces this strong bullish narrative. Following a brief period of minor consolidation around 6600, the SPX experienced three consecutive days of higher closes, pushing into new territory. The most recent daily candle for 2025-09-22 closed near its high (6693.75 vs. high of 6698.88), opening higher than the previous day and demonstrating strong buying pressure throughout the session. The RSI_14_DAY indicator has simultaneously surged, moving from 67.51 on 2025-09-12 to 74.75 on 2025-09-22. This reading places the SPX well into overbought territory, indicating a high level of buying intensity and potentially elevated optimism in the market.
From a structural perspective, the most immediate resistance is the intraday high of 6698.88 from 2025-09-22, representing the current all-time high within the provided data. Should this level be surpassed, new resistance levels would need to be projected based on extension techniques, which are beyond the scope of the provided data. Conversely, immediate support levels are likely found at the 2025-09-22 intraday low of 6648.07, and subsequently around the prior swing highs/closes near 6664.36 (2025-09-19 close) and 6631.96 (2025-09-18 close). More robust dynamic support is offered by the rising EMA_50_DAY, currently at 6421.88, which has historically acted as a reliable floor during sustained uptrends.
Considering future price action, a bullish case suggests a continuation of the prevailing upward trend, with the SPX likely to challenge and surpass the 6698.88 resistance to establish new all-time highs. The strong close on 2025-09-22 and persistent momentum indicated by the EMAs support this outlook. A bearish case posits a near-term pullback. The significantly overbought RSI at 74.75 indicates that a period of consolidation or a retracement is a roughly even chance. Such a pullback would likely test the immediate support zones or potentially the EMA_50. However, in the absence of a distinct bearish reversal pattern, this would more likely be a healthy correction within an ongoing uptrend rather than a trend reversal.
A neutral case suggests the market may enter a period of sideways consolidation to digest the recent gains, allowing the RSI to cool down from overbought conditions without a substantial price decline. This could manifest as price trading within a relatively tight range, perhaps between 6600 and 6700, building energy for the next directional move. Sentiment drivers, derived purely from this technical data, indicate a market likely characterized by heightened optimism or even mild euphoria, given the persistent new highs and elevated RSI. This optimistic sentiment could fuel further upward movement, or it might render the market vulnerable to a wave of profit-taking, increasing the probability of a short-term correction.
SPX Technical Commentary: September 22, 2025
The S&P 500 (SPX) has demonstrated a clear and sustained upward trend over the past 90 trading days. Since mid-May, the index has advanced from levels around 5890 to its most recent closing price of 6693.75, establishing a consistent pattern of higher highs and higher lows. A notable, albeit temporary, interruption to this ascent occurred in early August, where the index experienced a moderate pullback from approximately 6340 to 6238.01, before promptly resuming its bullish trajectory and continuing to forge new highs into September.
The 14-day Relative Strength Index (RSI) currently registers at 74.75, placing the index firmly within overbought territory. Historical observation within this 90-day dataset reveals that prior instances of RSI exceeding the 70 threshold (specifically in late June/early July and late July) were followed by periods of either price consolidation or moderate pullbacks in the SPX. Given this historical precedent, it is likely that the market may experience a cooling period or a minor correction in the near future as momentum potentially decelerates from these elevated levels. However, it is important to acknowledge that in strong, persistent uptrends, the RSI can remain overbought for extended durations.
In a somewhat contrasting assessment, the Percentage Price Oscillator (PPO) with 13 and 21-day EMAs provides insight into the underlying momentum. Following a dip in early August that coincided with the market’s price pullback, the PPO has displayed a consistent and strong upward trajectory, rising from approximately 0.38 to its current value of 0.635. A positive and steadily increasing PPO suggests that bullish momentum is robust and potentially accelerating, providing a firm technical underpinning for the recent price advances. This strong momentum component makes a significant, immediate reversal of the primary upward trend unlikely.
Considering both indicators, a period of modest consolidation or a slight pullback in price appears likely due to the RSI signaling an overbought condition. Nevertheless, the robust bullish momentum indicated by the rising PPO suggests that any potential pullback would likely be shallow and relatively short-lived, with the broader uptrend remaining intact. An alternative, albeit less probable, scenario is that the price continues its ascent, with the RSI remaining in overbought territory as the market extends its current strong impulse. A decisive break below recent support levels, particularly those established in late August around 6400-6450, would be required to shift the near-term outlook to a more bearish bias, though this outcome is currently unlikely given the prevailing momentum.