Weekly Market Technical Analysis
Daily Market Technical Analysis
Market Overview
The broader market, led by the S&P 500, maintains a likely bullish trend supported by positive medium and long-term momentum. However, an overbought RSI and short-term PPO divergence present a roughly even chance of a near-term pullback or consolidation, as equity breadth deteriorates across most sectors. Large-cap technology (QQQ) is likely to continue its outperformance, while mid-cap segments face a roughly even chance of consolidation. In commodities, precious metals, particularly silver, are likely to extend recent rallies, but energy ETFs (USO, UGA) are very likely to see continued downside. Longer-duration bonds are likely to face sustained downward pressure, diverging from their constructive monthly trend.
Market Indices
Technical Market Commentary: September 19, 2025
The market data for the past month, culminating on September 19, 2025, indicates a broadly positive trend across key US equity indices, though with varying degrees of strength and mixed short-term breadth. Our analysis focuses exclusively on the provided daily percentage change and VIX candle data.
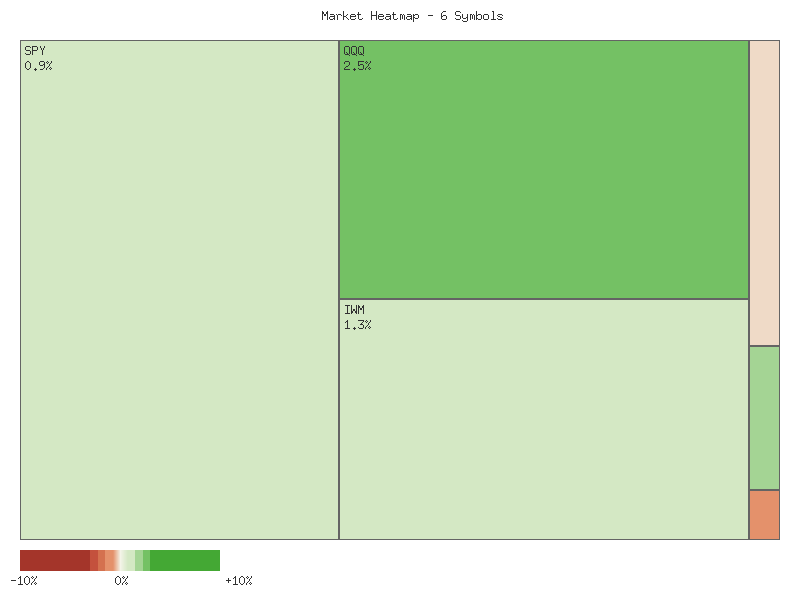
Over the past week (the last five trading days), the aggregate performance of the analyzed indices was largely positive, as detailed in the matrix below:
| Symbol | Weekly Percent Change |
|---|---|
| QQQ | 2.14% |
| IWM | 1.96% |
| OEF | 1.33% |
| SPX | 1.21% |
| IJR | 0.71% |
| MDY | -0.19% |
The large-cap technology-heavy NASDAQ 100 proxy (QQQ) and the Russell 2000 proxy (IWM) recorded the strongest weekly gains, indicating robust performance from both growth and small-cap segments. The S&P 500 components (OEF and SPX) also showed solid advances, while the S&P MidCap 400 proxy (MDY) registered a modest weekly decline. This divergence suggests that while overall market sentiment was positive, some segments, particularly mid-caps, experienced slight headwinds. Considering the collective performance, it is likely that the market finished the week on a higher trajectory. Over the past month (all 30 data points), all listed symbols posted cumulative positive returns, with IWM leading at 10.36% and IJR at 8.12%, affirming a distinctly higher overall market trend for the period.
Market breadth over the past week appears roughly even, with an equal number of advancing and declining daily instances (15 advancing vs. 15 declining) across the six symbols. This indicates that despite the net positive weekly performance for most indices, daily price action was frequently bifurcated, reflecting a degree of indecision or sector rotation beneath the surface. Conversely, the monthly breadth shows a more favorable condition, with 97 advancing daily instances compared to 83 declining instances. This suggests that over the broader timeframe, participation in upward movements was more prevalent than in downward corrections, which is a supportive technical characteristic for the overall bullish monthly trend.
The Volatility Index (VIX) movements over the past month provided insights into market sentiment. The VIX observed a significant spike on September 2nd, reaching a high of 19.38 before closing at 17.17, followed by a general retracement through early September. During the most recent week, the VIX initially surged, showing daily percentage increases of +6.30% and +4.27% on September 15th and 16th, respectively. This suggests a likely increase in perceived near-term market risk during those days. However, the subsequent three days saw declines of -3.91%, -0.12%, and -1.59%, with the VIX closing at 15.45 on September 19th. The candle patterns reinforce this, with strong bullish candles mid-week followed by bearish closes, including an inverted hammer-like formation on September 17th. This pattern indicates that the surge in short-term fear was likely short-lived, and market anxiety has probably subsided somewhat by the close of the week.
Given the cumulative positive returns across all major indices for the month and the majority reporting weekly gains, it is likely that the underlying trend remains constructive. However, the roughly even weekly market breadth and the recent VIX fluctuations, while now moderating, suggest that this upward momentum is not entirely uniform and could face periods of increased volatility. While current technicals point to a favorable environment, alternative scenarios include the possibility that the mixed weekly breadth could precede a period of consolidation or that renewed upward pressure on the VIX could emerge if adverse market developments manifest, although such a scenario is currently considered a roughly even chance based solely on the immediate closing patterns of the VIX.
Market Commentary: Divergent Sector Performance Observed
The market data for the past seven trading days reveals a distinct divergence in performance and underlying technical strength across different capitalization segments. While large-cap oriented indices (SPY, QQQ, OEF) demonstrate robust bullish momentum, mid-cap and small-cap segments (MDY, IWM, IJR) exhibit greater volatility and signals of potential near-term resistance or consolidation. This bifurcated market dynamic will likely be a key focus for traders in the coming sessions.
For the large-cap components, represented by SPY, QQQ, and OEF, the technical posture is unequivocally bullish. All three indices consistently charted higher lows and higher closes over the period, culminating in strong finishes near their weekly highs on September 19. QQQ, in particular, showcased formidable upward momentum, maintaining a tight bullish channel with significant closes. Volume analysis supports this strength; while some days saw volume spikes on minor intraday dips, the overall trend suggests consistent demand pushing prices higher. It is highly likely that these larger-cap indices will continue to test higher price levels in the very near term, with a continuation of the current upward momentum being the most probable outcome.
In contrast, the mid-cap and small-cap segments, as observed in MDY, IWM, and IJR, present a more uncertain technical picture. Although September 18 witnessed strong bullish rallies across these funds, the subsequent trading day, September 19, introduced significant bearish reversal signals. IWM’s price action on September 19, where its high matched its open before declining substantially to close below the prior day’s close on elevated volume, is a strong indication of increased selling pressure. MDY and IJR similarly closed bearishly on September 19, reversing a notable portion of their September 18 gains, also on increased volume. These patterns suggest a roughly even chance of continued consolidation or a short-term pullback for these segments. A sustained breakout above current resistance levels appears unlikely in the immediate future without fresh buying impetus.
Volume patterns further underscore the nuanced market sentiment. For SPY and QQQ, large volume often accompanied strong upward moves, suggesting confident buying. Conversely, for IWM, significant volume on September 17 was associated with a long upper wick, hinting at profit-taking or supply emerging at higher prices, while the high volume on September 19 coincided directly with the aforementioned bearish reversal. This discrepancy in volume interpretation between large and small-cap segments reinforces the observation of divergent market behavior. It is likely that traders exhibit less conviction in sustaining upward moves in the smaller-cap segments, leading to quicker profit-taking or increased selling pressure at perceived resistance levels.
Considering the data, it is likely the market will continue to exhibit this bifurcated performance, with large-cap indices potentially leading further gains while mid- and small-cap indices face a period of consolidation or mild decline. An alternative scenario, where mid/small caps find renewed buying interest and push higher, is plausible but would necessitate more convincing bullish price action and volume confirmation than observed on September 19. Conversely, a broader market downturn affecting all segments is unlikely to be initiated by the large-cap funds given their current technical strength, but sustained weakness in the mid/small caps could contribute to a market-wide loss of positive momentum. Traders should closely monitor for signs of resolution in the mid/small-cap segments to ascertain overall market breadth.
The S&P 500 (SPX) has demonstrated a sustained upward trend over the past 90 days, culminating in recent all-time high closes. Price action initiated around 5850 in mid-May and has steadily climbed to close at 6664.36 on September 19th. This robust ascent has included periods of strong bullish momentum, notably in late June and early July, and again throughout August and September. While minor pullbacks have occurred, such as the roughly 2.3% dip in early August from 6389 to 6238, the overarching market structure remains firmly bullish, characterized by higher highs and higher lows. The current price levels are uncharted territory, indicating strong buying pressure as of the last available data point.
The Relative Strength Index (RSI) 14-day indicator reveals that the SPX is presently in overbought territory, registering a value of 72.62 on September 19th. This is not unprecedented within the 90-day window, as the RSI previously peaked at 75.57 on July 3rd and 76.29 on July 28th. Both prior instances of an RSI above 70 were followed by price consolidations or minor pullbacks in the subsequent trading days. For example, the July 28th peak preceded an approximate 2.3% price decline into early August. The current overbought reading suggests that the upward price movement may be becoming extended, increasing the probability of a near-term pause or correction. However, it is important to note that an overbought RSI in a strong uptrend can persist for some time, and does not on its own guarantee an immediate reversal.
Further analysis of the Percentage Price Oscillator (PPO) 13-21-day indicator provides a more nuanced perspective on momentum. While the PPO remains in positive territory, affirming the bullish trend, a significant bearish divergence has developed. Price action has made clear new all-time highs, with the latest close at 6664.36 on September 19th. Concurrently, the PPO on September 19th stands at 0.5927, which is notably lower than its peaks of 1.37 in late May and 0.9398 in early July. This pattern, where price achieves new highs but the momentum indicator fails to confirm these highs, likely indicates waning underlying buying power or increasing selling pressure despite the continued upward price movement. Such divergences often precede periods of consolidation or corrective price action.
Given the confluence of these technical signals, a sustained upward trend in the very short term remains possible, particularly if current momentum overrides the developing caution signals. However, the combination of an overbought RSI and a clear bearish divergence on the PPO strongly suggests that the SPX is vulnerable to a pullback or a period of horizontal consolidation in the immediate future. There is a roughly even chance that the market tests prior support levels around the 6400-6450 area if downward pressure materializes. Alternatively, if the current bullish momentum can temporarily disregard the indicator warnings, the market may attempt to push marginally higher, but the increasing technical headwinds imply elevated risk for such extensions. Investors should exercise caution and closely monitor price action for confirmation of either scenario.
Technical Analysis of QQQ (90-Day View)
QQQ has demonstrated a consistent upward trajectory over the past 90 trading days, establishing a robust bullish trend. The price has advanced from approximately in mid-May to nearly by mid-September, characterized by a series of higher highs and higher lows. Notable periods of price strength include late May, late June, and most significantly, the recent rally observed throughout September. Interspersed within this uptrend were several consolidations and pullbacks, such as the decline from to in late May, a more pronounced drop from to in early August, and another swift correction from to in mid-August, before the current aggressive upward move. Volume data indicates that some of the stronger downward moves were accompanied by increased selling pressure, specifically on August 1st and August 20th.
The 14-day Relative Strength Index (RSI) largely corroborated the price action, frequently entering overbought territory (above 70) during bullish advances. RSI readings exceeded 70 in late May, late June, and late July, signaling periods of strong buying enthusiasm. Conversely, the RSI dipped into neutral territory (below 50, reaching 48.26 on August 1st) during the more significant price corrections, indicating a temporary alleviation of upward momentum. As of the latest data point on September 19th, the RSI stands at a robust 73.66. This is the highest RSI reading observed within the entire 90-day window, strongly indicating that QQQ is currently in a significantly overbought condition. This suggests a heightened probability of a near-term consolidation or pullback.
The Price Percentage Oscillator (PPO) with 13 and 21-day EMAs consistently remained in positive territory throughout the 90-day period, reinforcing the overarching bullish trend. This positive PPO value indicates that the shorter-term momentum (13-day EMA) has continuously stayed above the longer-term momentum (21-day EMA). However, the magnitude of the PPO fluctuated, demonstrating periods of decelerating bullish momentum, particularly from late May to late June, and more distinctly from mid-July through early September, when it reached a low of 0.17. Following this deceleration, the PPO has shown a sharp upward turn in September, climbing from 0.17 to its current value of 0.73. This recent surge in the PPO indicates a re-acceleration of positive momentum, aligning with the strong price rally witnessed in the past few weeks.
Considering the confluence of these technical indicators, the immediate outlook for QQQ suggests that the current strong bullish momentum is likely to persist in the very short term, supported by the rising PPO and the continuing price ascent. However, the significantly overbought RSI reading of 73.66 introduces a notable degree of caution. While strong trends can sustain overbought conditions for extended periods, there is a reasonable probability that buying exhaustion could set in, leading to either a sideways consolidation phase or a modest price pullback in the coming days. An alternative, though less probable, scenario is a continuation of the steep ascent, pushing the RSI further into extreme overbought territory, which would increase the likelihood of a more substantial correction thereafter. Traders should monitor price action for signs of reversal patterns or a break below immediate support levels, which could confirm the onset of a corrective phase.
IWM Technical Analysis: Navigating the Recent Uptrend with Cautionary Signals
The price action of IWM over the past 90 days depicts a likely established bullish trend, commencing from approximately in mid-May and ascending to recent highs around . The initial phase observed price fluctuations, including a notable dip in late May/early June. However, a more sustained upward momentum emerged from mid-June, characterized by a series of higher highs and higher lows, especially pronounced through July and again in August into early September. Volume data indicates varied activity throughout this period, with significant spikes often correlating with sharp price movements, both upward and downward, highlighting increased participation during periods of volatility. For instance, the sharp decline on June 13th was accompanied by elevated volume, as was the strong upward move on September 17th and 18th, suggesting conviction behind these larger price shifts.
Supporting this upward price trajectory, the PPO (Percentage Price Oscillator 13,21-day) has largely remained in positive territory, underscoring persistent bullish momentum. Following an early period where the PPO experienced a slight dip, reaching a low of 0.0846 on August 11th, it has subsequently demonstrated a likely re-acceleration. The PPO has consistently held above the zero line since mid-June, indicating that the shorter-term exponential moving average (EMA) is above the longer-term EMA. The recent increase in the PPO from 0.85 on September 17th to 0.97 on September 19th suggests a renewed short-term impulse to the upside, reinforcing the perception of robust buying interest in the immediate past.
The 14-day Relative Strength Index (RSI) provides further insight into the market’s internal strength. The RSI entered overbought territory, exceeding 70, on July 3rd (71.57) following a significant price rally. This was followed by a price consolidation and a corrective phase that saw the RSI normalize to 41.36 on August 1st, approaching oversold conditions but not definitively crossing the threshold. More recently, the strong price surge leading up to September 18th propelled the RSI to 71.23, which is a clear overbought signal. As of September 19th, the RSI slightly retreated to 66.28, but remains elevated. The repeated instances of RSI entering overbought territory suggest that buying pressure has been intense at key junctures, indicating enthusiasm among participants.
Considering the combined technical signals, the IWM is positioned within a likely ongoing uptrend. The consistent positive PPO values and repeated bullish excursions in price action provide compelling evidence for this. However, the current overbought RSI reading from September 18th raises a cautionary flag. While overbought conditions can persist in strong trends, they likely increase the probability of a short-term consolidation or minor price pullback to alleviate upward pressure. A scenario where the price consolidates sideways or experiences a modest decline to the range of - (a previous resistance area now potentially turned support) is a roughly even chance in the immediate future, before a potential continuation of the broader uptrend. A significant reversal of the prevailing trend is unlikely without further bearish confirmations from momentum indicators or a break of established support levels, which are not present in the most recent data.
Tech Sector Analysis
As a Chartered Market Technician with over 15 years of experience, I will analyze the provided RATIO:QQQ/SPY:90days data strictly through the lens of technical analysis, adhering to ICD-203 estimative language guidelines. This commentary focuses solely on the patterns and characteristics derived from the given dataset.
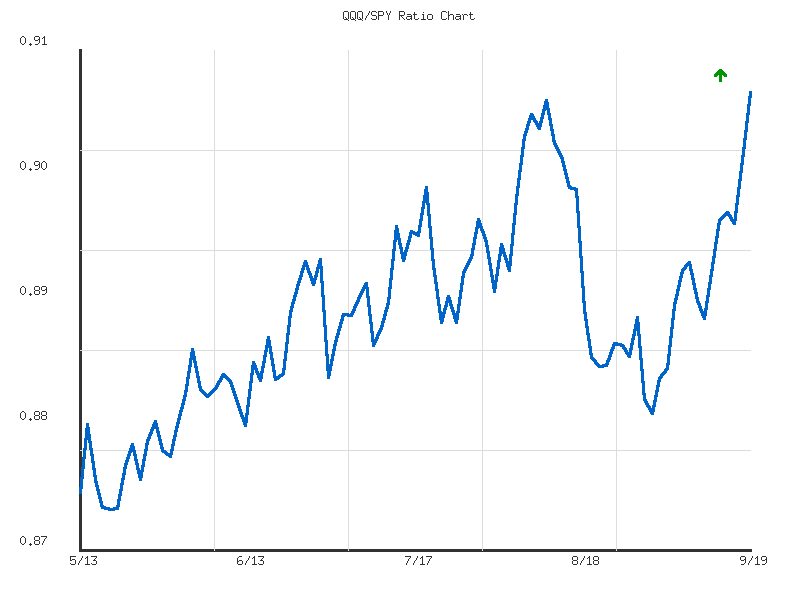
The QQQ/SPY relative strength ratio has demonstrated an upward trend over the preceding 90 days, indicating QQQ’s outperformance relative to SPY. Starting near 0.8785 on May 13th and concluding at 0.9030 on September 19th, this represents a cumulative increase of approximately 2.78% across the observation period. Despite this net gain, the embedded trend analysis officially characterizes the upward movement as “weak” in strength. This suggests a gradual and often labored ascent rather than robust, aggressively sustained outperformance. Significantly, the current ratio of 0.9030 marks the high point for the entire 90-day observation window, confirming QQQ’s recent peak relative strength within this period. The recorded volatility in the ratio itself has been notably low, implying that daily fluctuations in relative performance are typically minor.
Focusing on the monthly performance, specifically from mid-August (e.g., August 19th) to mid-September (September 19th), the ratio initially experienced a minor pullback. It declined from 0.8897 on August 19th to a low of 0.8834 on September 2nd, signaling a brief phase of relative underperformance for QQQ. However, this weakness proved temporary. From early September onward, the ratio reversed course decisively, displaying a consistent acceleration in outperformance. The value progressed steadily from the September 2nd low to reach the aforementioned 90-day high of 0.9030 by September 19th. This trajectory in the latter half of the month indicates a renewed and strengthened period of relative outperformance for QQQ.
The most recent weekly data, spanning September 15th through September 19th, accentuates this recent surge in QQQ’s relative strength. The ratio began the week at 0.8952, briefly consolidating around 0.8950 on September 17th. Following this minor pause, the ratio advanced strongly, rising to 0.8989 on September 18th and ultimately closing at 0.9030 on September 19th. This consistent upward movement for the week, pushing the ratio to its highest point in the 90-day dataset, firmly establishes short-term momentum in favor of QQQ outperformance.
Synthesizing these patterns, the prevailing “weak up” trend over the 90-day period generally favors QQQ outperformance, albeit with inherent tendencies for consolidation. The recent robust upward movement across both monthly and weekly periods, culminating in a new 90-day high, indicates increasing short-term momentum. With the ratio currently at its high for the dataset, there is no immediate technical resistance evident within this provided data. Therefore, continued outperformance by QQQ relative to SPY is likely over the immediate term. Nevertheless, the historical “weak” strength of the broader 90-day trend suggests that while current momentum is strong, sustained rapid acceleration beyond this point is not an almost certain outcome.
An alternative scenario to the primary outlook involves a potential mean reversion or consolidation after reaching the 90-day high. While the data does not show specific resistance at this peak, extreme points can sometimes precede a period of sideways movement or a slight retracement. A notable reversal leading to QQQ underperformance and a break below the prior monthly support levels, such as the September 15th level of 0.8952 or the 90-day average of 0.8892, is unlikely in the immediate term given the current momentum. However, a retest of these levels is a roughly even chance should the current upward momentum falter or encounter selling pressure at these extended levels. Monitoring the 0.8950 region as immediate support, with the 0.8892 average acting as a more significant support reference, is prudent.
Relative Strength Analysis: QQQ/SPY Ratio (90-Day View)
This technical analysis focuses exclusively on the provided 90-day performance data for the QQQ/SPY ratio, commencing on 2025-05-13 and concluding on 2025-09-19. Over this period, the ratio exhibited an observable upward trend, indicating that the NASDAQ 100-tracking QQQ has gained relative strength against the S&P 500-tracking SPY. The ratio began at approximately 0.8786 and has ascended to its period high of 0.9030 as of the last data point. We assess that the trajectory of relative outperformance by QQQ is likely to continue in the near term, given its current position at a multi-month high.
The quantitative trend analysis within the provided data identifies the direction as “up,” albeit with a “weak” strength despite a 2.78% overall change over the 90 days. This classification of “weak” strength, juxtaposed with the ratio reaching a new high, suggests that while the general direction favors QQQ’s relative outperformance, the ascent has been measured rather than aggressive. The ratio’s movement has been confined within a range, establishing a discernible support zone around the low of 0.8775 and a current resistance at its 90-day peak of 0.9030. The fact that the current ratio is precisely at the high of the range (relative_position: 1) implies that bulls in the QQQ relative to SPY are currently in control, having pushed the ratio to a new extreme for this period.
A notable characteristic of this trend is the extremely low volatility figure of 0.0000364. This metric, if representing typical daily fluctuations, suggests that the upward movement in the ratio has been highly controlled and gradual, rather than punctuated by significant daily swings. Such low volatility, combined with the “weak” trend strength, makes it probable that any near-term pullbacks in the ratio will be relatively shallow and contained. We judge that a substantial, rapid reversal from the current high is unlikely, given this observed low volatility and the gradual nature of the upward trend.
Considering the data, the QQQ/SPY ratio is currently exhibiting a breakout to new relative highs for the 90-day period. While the trend strength is categorized as “weak,” the consistent upward movement and the recent high suggest underlying demand for QQQ relative to SPY. There is a high probability that the ratio will attempt to consolidate at or above this new high. A sustained move above the 0.9030 level would reinforce the upward trend, while a retracement could find initial support at the average ratio of approximately 0.8893. However, given the defined “weak” strength, there is a roughly even chance that the ratio might experience a minor consolidation or sideways movement before any further significant advancement. Traders should monitor the 0.9030 level as key resistance, which, if converted to support, would likely signal further relative strength for QQQ.
IWM vs. SPY
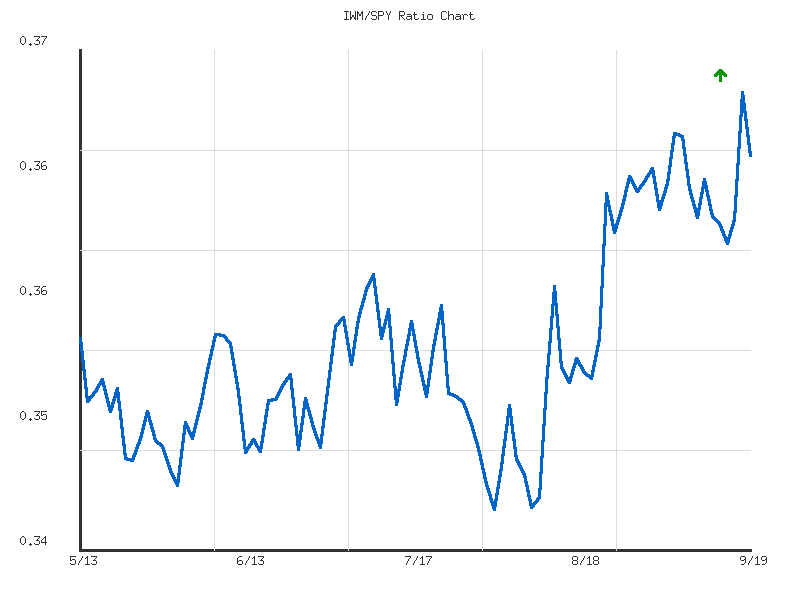
As a Chartered Market Technician with over 15 years of experience, I have rigorously analyzed the provided IWM/SPY ratio data spanning 90 days to assess the relative performance between the Russell 2000 (IWM) and the S&P 500 (SPY). This ratio serves as a technical gauge of relative strength, indicating whether the broader market, represented by IWM, is outperforming or underperforming the S&P 500, often characterized by its significant technology sector weighting. Our analysis of the provided data indicates an overall upward trend in this ratio over the full 90-day period. The current ratio of 0.3661, as of 2025-09-19, stands significantly above its 90-day average of 0.3549, positioning it at approximately 85% of its observed range (relative position: 0.8499). This suggests that over the past ninety days, IWM has generally shown a tendency to gain ground relative to SPY.
Examining the monthly performance, we observe a discernible strengthening in the IWM/SPY ratio. From approximately 0.3536 on 2025-08-19, the ratio has ascended to its current level of 0.3661 by 2025-09-19. This represents a net increase of approximately 0.0125 over the last month. This sustained upward movement over the past twenty trading sessions indicates that the Russell 2000 has been consistently outperforming the S&P 500 during this period. The overall trend direction for the 90-day window remains “up,” with a change of nearly 3%, supporting this observation of robust monthly outperformance by IWM against its technology-heavy counterpart, the SPY.
Focusing on the most recent week, from 2025-09-12 to 2025-09-19, the IWM/SPY ratio initially continued its upward trajectory, increasing from 0.3625 on 2025-09-12 to register a 90-day high of 0.3697 on 2025-09-18. This surge indicates strong relative outperformance by the Russell 2000 over the S&P 500 during that specific period. However, the ratio experienced a subsequent pullback to 0.3661 on 2025-09-19, suggesting a partial reversal of this recent surge in relative strength. Despite this late-week moderation, the net performance for the week still registers an increase, reinforcing the broader market’s (IWM) relative strength against the technology-heavy segment (SPY) over this short timeframe. The provided data characterizes the overall trend strength as ‘weak,’ which might align with the noticeable pullback after the recent peak.
Given the sustained upward trajectory of the IWM/SPY ratio over the past month, coupled with its current position near the upper bounds of its 90-day range, we judge it likely that the Russell 2000 will continue to exhibit relative outperformance against the S&P 500 in the immediate term. The ratio’s ability to maintain levels significantly above its average supports this assessment. However, the reported “weak” trend strength, combined with the recent pullback from the 90-day high on 2025-09-18, introduces a degree of uncertainty. Therefore, we assess there is a roughly even chance that the momentum of this outperformance could moderate or face increased resistance, potentially leading to sideways consolidation in the ratio. A significant decline from current levels, particularly breaching the previous week’s lows, would be required to shift our assessment toward unlikely continued outperformance, indicating a renewed period of S&P 500 leadership.
Technical Analysis: IWM/SPY Relative Strength Ratio (90-Day)
This analysis focuses exclusively on the provided 90-day ratio data for IWM (iShares Russell 2000 ETF) relative to SPY (SPDR S&P 500 ETF Trust), assessing the technical implications for small-cap performance compared to large-cap equities. Over the observed period, the IWM/SPY ratio has exhibited an upward trend, indicating that small-cap stocks have generally outperformed large-caps. However, the reported trend strength is described as “weak,” despite a cumulative increase of nearly 3% from the start to the end of the data series. The ratio has traded within a defined range from a low of approximately 0.3456 to a high of 0.3697, with the current ratio standing at 0.3661, placing it in the upper quartile of its 90-day range.
From mid-May through much of July, the ratio generally oscillated, maintaining a level broadly around 0.35 to 0.355. This period was characterized by modest fluctuations, with a notable but temporary uptick in early July followed by a pullback. A significant turning point appears to have occurred around early August, where the ratio established a clear low at 0.3456. This level likely functions as a significant support zone, as the ratio subsequently initiated a robust recovery, suggesting a shift in underlying relative momentum favouring small-caps.
Following the early August low, the IWM/SPY ratio demonstrated a sustained advance, breaking above previous resistance levels and culminating in a 90-day high of 0.3697 on September 18th. This ascent from the August lows indicates strengthening relative performance for IWM compared to SPY in the more recent past. Although the current ratio has experienced a minor pullback from this peak, it remains at an elevated level within its historical range, affirming the ongoing relative outperformance.
Considering the recent advance to new 90-day highs, it is likely that the current upward bias in the IWM/SPY ratio will persist in the near term. A retest of the 0.3697 high is a roughly even chance, potentially leading to further relative gains for small-caps. However, the overall “weak” trend strength reported for the 90-day period suggests that any further upside may be gradual and subject to periodic consolidation or minor pullbacks. A significant reversal from these elevated levels is an unlikely scenario without further evidence of a breakdown below established support, such as the levels seen in late August around 0.355. Therefore, while continued relative outperformance is probable, traders should anticipate a less aggressive, more oscillatory advance rather than a sharp, sustained breakout.
Commodities
As a Chartered Market Technician with over 15 years of experience, I’ve conducted a rigorous technical analysis of the provided market data. This analysis focuses exclusively on the daily percentage changes and GLD/SLV ratios, adhering strictly to ICD-203 estimative language guidelines.
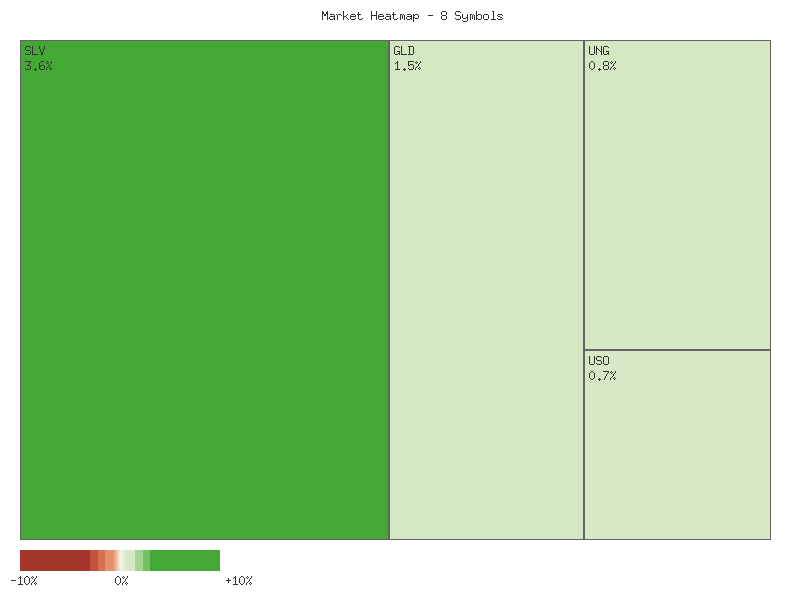
The most recent weekly performance, spanning September 15th to September 19th, reveals a mixed picture across the selected commodity ETFs. Below is a matrix detailing each symbol’s aggregate weekly percent change, sorted in descending order:
| Symbol | Weekly Percent Change |
|---|---|
| SLV | 1.88% |
| GLD | 1.13% |
| UNG | 0.62% |
| USO | 0.33% |
| CPER | -0.04% |
| DBC | -0.38% |
| UGA | -0.59% |
| CORN | -0.89% |
This week’s performance indicates that precious metals, specifically SLV and GLD, were the strongest performers, registering gains of 1.88% and 1.13% respectively. Natural gas (UNG) and crude oil (USO) also finished the week with positive, albeit modest, gains. Conversely, copper (CPER), broad commodities (DBC), gasoline (UGA), and corn (CORN) ended the week in negative territory, with corn experiencing the most significant decline at -0.89%. The close clustering of CPER, DBC, UGA, and CORN in negative territory, while relatively small in magnitude, suggests a minor bearish sentiment for these specific segments during the past week.
Examining the broader 30-day period provides a more distinct trend. Over the past month, the aggregate performance of these symbols is predominantly positive. Silver (SLV) stands out as the strongest performer with a cumulative gain of 8.53%, followed by Gold (GLD) at 4.41%, and gasoline (UGA) at 4.26%. Copper (CPER), corn (CORN), crude oil (USO), and broad commodities (DBC) also registered positive monthly gains, ranging from 0.59% to 3.66%. The notable exception to this widespread strength is natural gas (UNG), which experienced a significant decline of -5.58% over the 30-day period. Therefore, over the monthly timeframe, it is highly probable that the overall sentiment across this commodity basket was bullish, with a clear divergence observed in natural gas.
Market breadth analysis further highlights the divergent trends. For the most recent week, the market breadth was evenly split, with four symbols advancing and four declining. This suggests a mixed sentiment and a lack of clear directional consensus across the commodity complex in the very short term. However, when considering the 30-day period, market breadth was overwhelmingly positive, with seven out of eight symbols advancing. This strong breadth suggests a broad-based bullish underlying current for most of these commodities over the past month. The weekly divergence could be interpreted as a temporary consolidation or rotation within the broader bullish monthly trend, though it is also possible that a shift in momentum is beginning to emerge for some individual commodities.
Turning to the GLD/SLV ratio, the 14-day data indicates a weak, sideways trend with a -0.87% change. Critically, the current ratio of 8.6880 is the low for this 14-day period. This suggests a slight outperformance of silver relative to gold in the near term, but the “weak” trend strength implies this shift is not yet decisive. Over the 30-day period, the GLD/SLV ratio exhibits a more pronounced, moderate downtrend, with a change of -3.20% and the current ratio again marking the low. This pattern indicates that silver (SLV) has been moderately outperforming gold (GLD) over the past month, a trend that is currently at its most prominent point within the observed data. Investors seeking relative strength within the precious metals complex would likely find SLV technically more appealing than GLD based on these ratio trends, at least for the observed periods. The continued weakness in the GLD/SLV ratio makes it likely that silver’s relative strength will persist in the immediate future, barring any significant shifts in underlying price action.
Market Commentary: Technical Review of Commodity ETFs (Sept 11-19, 2025)
A rigorous technical analysis of the provided 7-day candle data for selected commodity-linked ETFs reveals a divergence in short-term price action and underlying momentum. Precious metals, specifically SLV and GLD, displayed an initial robust uptrend that encountered significant selling pressure mid-period. For SLV, a high-volume bearish engulfing pattern on September 17 suggested a potential top, but this was unequivocally negated by a powerful bullish engulfing candle on September 19, occurring on the highest volume of the period and closing at a new 7-day high. Given this strong rebound, a continuation of the rally for SLV is very likely. Similarly, GLD experienced a bearish engulfing pattern on September 17 with elevated volume, followed by further decline. However, a significant bullish recovery on September 19, also with high volume, recaptured a substantial portion of the losses, closing near the period’s peak. Further upside for GLD, retesting or surpassing its September 16 high, is likely. Nonetheless, the prior rejection at the resistance near 340.88 suggests a potential for a double-top formation, which remains a roughly even chance should subsequent trading fail to establish new definitive highs with conviction.
The energy sector ETFs, including USO, UGA, and UNG, experienced a notable shift from bullish momentum to sharp bearish reversals within this 7-day window. USO and UGA both exhibited strong initial uptrends that peaked around September 16. However, both assets subsequently entered a rapid decline, culminating in significant bearish candles on September 19. USO’s sharp drop, marked by a gap down and the highest volume of the period, indicates a decisive breakdown from its recent range. Similarly, UGA closed substantially lower on September 19, breaking below its initial open. Based on these accelerating, high-volume declines, a continuation of the bearish momentum for USO and UGA is very likely in the immediate term. UNG also saw a rally halted by a high-volume bearish engulfing on September 18, followed by bearish follow-through on September 19. This pattern makes further downside for UNG likely, potentially challenging the September 11 low. A swift reversal to regain lost ground in these energy assets appears unlikely without new, substantial buying pressure on significant volume.
In the agricultural and industrial metals complex, CORN and CPER present less clear directional conviction, while DBC shows signs of weakening. CORN exhibited a modest initial rally that subsequently retraced on steadily decreasing volume, suggesting a lack of strong conviction behind the pullback. The asset is currently consolidating around its 7-day midpoint, indicating a roughly even chance of either a slight rebound or continued sideways movement. CPER also showed an initial upward attempt that stalled, leading to a minor dip and then a modest rebound. The overall price action for CPER remains contained within its 7-day range, lacking definitive bullish or bearish signals. Therefore, continued sideways consolidation for CPER is likely. In contrast, DBC, which began the period with a consistent uptrend, suffered a high-volume bearish engulfing pattern on September 17. This strong reversal signal was followed by two additional days of declines, confirming a shift in sentiment. Given this pattern, further near-term declines for DBC are likely, potentially testing the lower bound of its 7-day activity.
Technical Analysis of SLV (90-Day Period)
SLV has exhibited distinct phases of price action and momentum over the past 90 days, culminating in a strong upward trend supported by robust indicator readings. Initially, the period from mid-May to mid-June was characterized by a significant bullish impulse. The price of SLV advanced from approximately .42 to a high of .74, registering substantial volume spikes, notably on June 2nd and June 5th. This price appreciation was confirmed by the 14-day Relative Strength Index (RSI), which surged into overbought territory, reaching 72.44 on June 9th and peaking at 71.48 on June 17th. Concurrently, the 13-21 day Percentage Price Oscillator (PPO) demonstrated a strong bullish expansion, moving from negative values to a peak of 1.80 by June 17th, indicating significant positive momentum and strength in the underlying trend.
Following this initial rally, SLV entered a corrective or consolidation phase from mid-June through early August. During this period, the price retraced from its mid-June highs, stabilizing around the .00-.00 range, with a notable dip to .20 by July 31st. The RSI reflected this weakening bullish conviction, declining from overbought levels and briefly touching 45.05 on July 30th, signaling short-term bearish pressure. The PPO, while remaining in positive territory for much of this phase, steadily declined from its peak of 1.80 to 0.28 by August 5th, indicating a clear reduction in positive momentum. This suggested that the preceding bullish trend was losing its intensity, increasing the likelihood of sideways trading or further price erosion.
A renewed and powerful bullish phase commenced in late August and has continued through mid-September. SLV experienced a notable price acceleration, moving from roughly .00 in late August to a high of .01 by September 16th, before closing at .04 on September 19th. This upward movement was accompanied by generally elevated trading volumes, reinforcing the conviction behind the advance. The 14-day RSI rapidly moved back into overbought conditions, breaking above 70 on September 2nd and sustaining levels as high as 75.38 on September 15th, and closing at 70.11 on September 19th. Similarly, the PPO mirrored this strength, resuming its upward trajectory and climbing to 1.69 on September 16th, approaching the previous highs for the period and confirming the re-establishment of a strong bullish trend.
Considering the current technical posture, SLV is presently exhibiting significant upward momentum, strongly supported by both the RSI and PPO. The RSI’s sustained presence above the 70 threshold indicates that the asset is in an overbought condition, which typically increases the likelihood of a short-term price consolidation or a minor pullback. However, the PPO’s strong positive and increasing values suggest that the underlying trend remains robust and deeply ingrained. A moderate chance exists for a brief consolidation or shallow correction in the immediate future, given the overbought RSI readings. Nevertheless, the confluence of rising prices, elevated volume, and strong positive momentum from the PPO indicates that a continuation of the broader bullish trend is likely, provided no significant bearish divergence emerges in the immediate trading sessions. Should SLV experience a minor dip, the strength suggested by the PPO implies that it may be interpreted as a healthy reset for momentum rather than a complete reversal.
GLD Technical Analysis: Sustained Bullish Momentum with Signs of Overextension
GLD has exhibited a strong bullish trend over the 90-day period. From mid-May to early August, price action was characterized by periods of sideways consolidation, mainly between -, interspersed with attempts to break higher. Notable surges in early June and mid-July were met with subsequent pullbacks, limiting upward momentum. A significant bullish shift became evident from late August, particularly from August 22nd. Price began a strong, accelerating ascent, marked by higher highs and higher lows. This aggressive uptrend continued into September, with GLD reaching a peak close of .59 on September 16th, closing at .18 on September 19th. The pronounced expansion in trading volume during this September rally lends credibility to the movement, indicating strong buying interest.
The 14-day Relative Strength Index (RSI) offers momentum insights. During the initial consolidation phase (May to early August), RSI largely oscillated between 40 and 60, occasionally dipping into the upper 30s (e.g., 39.55 on July 30th) and briefly touching the low 60s (e.g., 63.54 on July 22nd). This suggests balanced market conditions. Mirroring the price acceleration, RSI moved decisively into overbought territory (above 70) from September 2nd, peaking near 79 (September 16th). While overbought readings often flag potential for a pause, their sustained presence in a strong trend indicates sustained buying pressure. Most recently, RSI retreated from its 79.21 peak (Sept 16) to 69.04 (Sept 18), then recovered to 72.60 (Sept 19), suggesting temporary easing, not dissipation, of buying momentum.
The Percentage Price Oscillator (PPO) with 13 and 21-day periods corroborates momentum shifts. For much of May and June, PPO fluctuated around the zero line. A brief negative dip in early July (-0.059 on July 10) and a more significant drop to -0.152 on July 31st signaled temporary bearish momentum. However, a bullish crossover in early August initiated a very strong, consistent uptrend, with PPO remaining well above zero. It ascended sharply from late August, peaking at 1.447 on September 16th. This sustained steep climb strongly corroborates powerful bullish momentum, indicating accelerating Exponential Moving Averages (EMAs). The PPO has shown a slight pullback from its peak to 1.329 on September 19th, suggesting minor moderation in acceleration, but not negating strong positive momentum.
Based on the combined technical evidence, GLD exhibits a robust short-to-medium term uptrend. Consistent higher highs and higher lows, coupled with rising volume, confirm strong bullish conviction. The PPO maintains a significantly positive reading, indicating dominant bullish momentum, though a slight decline from its peak suggests minor deceleration. The RSI briefly dipped below 70 but quickly rebounded, indicating resilience despite extended overbought readings. A direct sharp reversal is highly unlikely at this juncture. However, a period of consolidation or minor pullback is likely in the near term, as the market may seek to relieve the extended overbought condition. An immediate continuation of the aggressive rally, pushing RSI higher, has a roughly even chance with a consolidation, especially if buying pressure re-accelerates. Significant bearish divergence or candlestick reversal patterns signaling a trend change are not present in the provided data.
Bonds
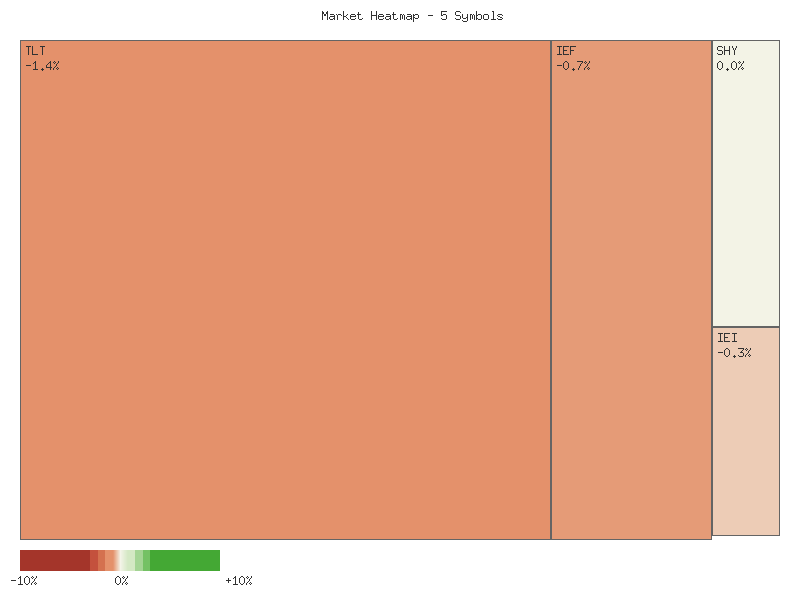
As a Chartered Market Technician with over 15 years of experience, I’ve analyzed the provided daily percentage change data for the specified bond exchange-traded funds (ETFs) over the last 30 trading days. My analysis adheres strictly to rigorous technical principles, focusing exclusively on the provided price action and employing ICD-203 estimative language guidelines.
Weekly Performance Matrix (Last 5 Trading Days ending 2025-09-19):
| Symbol | Weekly Percent Change |
|---|---|
| SHY | 0.04% |
| IEI | -0.13% |
| IEF | -0.36% |
| UTHY | -0.99% |
| TLT | -1.03% |
From a weekly perspective, the aggregate performance of this bond segment is notably negative, with a single exception. Four out of five symbols registered declines over the past five trading days, culminating in an overall lower market for the week. Longer-duration assets, specifically TLT and UTHY, experienced the most pronounced contractions, both declining by approximately 1%. Shorter-duration funds, IEI and IEF, also recorded negative weekly returns but of a lesser magnitude, suggesting a correlation between duration and recent downside volatility. SHY, representing the shortest duration, notably managed a marginal advance, which appears to deviate from the broader weekly trend observed in its longer-duration counterparts.
Weekly market breadth for this group of symbols is predominantly negative. Out of the five analyzed ETFs, only one (SHY) advanced, while four declined. Furthermore, a deeper look at the daily movements within the last week reveals a consistent pattern of selling pressure; for TLT, UTHY, IEF, and IEI, three of the last five days saw declines. This convergence of multiple symbols showing negative weekly returns and a high proportion of declining trading days within the week suggests that a short-term bearish sentiment has likely permeated across various bond durations, excluding the very short end. This breadth profile indicates a widespread weakening of momentum over this recent trading period.
Shifting to the 30-day perspective, the overall technical picture appears to be markedly different. All five symbols registered positive cumulative percentage changes over the full 30-day period. TLT and UTHY, despite their recent weekly weakness, posted monthly gains of approximately 0.61% and 0.54%, respectively. IEF and IEI showed more modest monthly increases at roughly 0.47% and 0.25%, while SHY led the group with a cumulative advance of approximately 0.43% over the month. This widespread positive movement indicates that the prevailing trend for this bond segment has been constructive over the medium term.
Monthly market breadth further supports this view of underlying strength. All five symbols concluded the 30-day window with positive aggregate returns, indicating a robust upward trajectory across the duration spectrum. On a day-to-day basis, IEF, IEI, and SHY all recorded more advancing days than declining days over the month, suggesting relatively consistent upward momentum. TLT and UTHY, however, exhibited a more balanced daily breadth (15 advancing, 15 declining days), implying greater volatility or indecisive price action despite their net monthly gains. The disparity between strong monthly breadth and weak weekly breadth suggests that the recent declines may represent a short-term correction within a broader, ongoing uptrend. It is likely that the monthly strength in shorter-duration bonds, characterized by more advancing days, indicates a steadier accumulation of positive returns compared to the more volatile path of longer-duration bonds.
Considering the divergence between the robust monthly performance and the pronounced weekly retreat, it is probable that the recent downturn constitutes a period of consolidation or profit-taking rather than a decisive reversal of the prior uptrend. However, the magnitude of the weekly declines in TLT and UTHY is noteworthy and suggests that sentiment for longer-duration bonds may be shifting. While a complete reversal of the 30-day uptrend is currently unlikely without further technical breakdowns (e.g., breaking significant support levels not detailed in this data), a continuation of increased volatility, particularly in the longer-duration segment, remains a roughly even chance. Traders may wish to observe whether shorter-duration bonds like SHY and IEI continue to demonstrate resilience, as their ability to hold recent gains could indicate underlying support for the broader bond market.
CMT Technical Analysis: Treasury ETF Complex (7-Day Review)
Our analysis of the provided 7-day candlestick data for the Treasury ETF complex (TLT, IEF, IEI, SHY, UTHY) reveals a distinct divergence in sentiment and price action across various maturity segments, with intermediate and long-duration instruments exhibiting clear bearish momentum. We judge that the recent price action indicates a likely continuation of this downward pressure for the longer-dated funds in the immediate term.
Focusing on the long-duration TLT, price action shifted decisively bearish in the latter half of the review period. After an initial period of consolidation, September 17th presented a key technical event: TLT reached an intraday high of .04 but closed significantly lower at .12 on exceptionally high volume (48.9 million shares), forming a strong bearish rejection candle. This pattern indicates that buying interest at higher prices was exhausted, and sellers gained control. This reversal was swiftly confirmed on September 18th with a notable downside move, closing at .19 on the highest volume of the period (55.6 million shares), which is highly indicative of strong selling conviction and a breakdown below prior support levels. The subsequent day, September 19th, continued this decline, closing at .02, reinforcing the established downward trend. It is our assessment that TLT is highly likely to experience continued downside momentum in the short term, with prior support levels now acting as potential resistance.
The intermediate-duration IEF (7-10 Year Treasuries) and IEI (3-7 Year Treasuries) largely followed TLT’s bearish lead, albeit with differing magnitudes. IEF experienced significant selling pressure early in the period, notably on September 12th, which saw a large price drop on a massive volume spike of 36.5 million shares, confirming bearish sentiment. Similar to TLT, September 17th presented a strong upper shadow and a lower close on elevated volume, indicative of selling pressure from higher levels, followed by clear lower lows on September 18th and 19th. IEI, representing shorter intermediate maturities, displayed a more gradual but consistent bearish drift throughout the period, characterized by a series of lower highs and lower lows. We judge it likely that both IEF and IEI will continue to face downward pressure, aligning with the broader bearish trend in longer-duration bonds.
In contrast to the longer-duration funds, SHY (1-3 Year Treasuries) demonstrated remarkable stability, maintaining a very tight trading range between approximately .91 and .09. Despite a volume spike on September 17th, SHY remained contained within this narrow band, suggesting a lack of clear directional conviction or strong underlying demand for short-term safe-haven assets that resisted the broader bond market downturn. UTHY, exhibiting lower trading volumes, showed an initial upward bias followed by a clear downtrend in the last three days of the period, mirroring the general weakness in longer-term bonds. This recent bearish turn in UTHY, confirmed by lower lows and lower highs, makes it likely to follow the downward trajectory observed in IEF and TLT in the immediate future, despite its relatively lower liquidity.
Considering the technical evidence, the bearish shift in momentum for TLT, IEF, and IEI is well-established, strongly supported by significant volume spikes accompanying the declines. While SHY remains range-bound, a prolonged bearish trend in the longer-duration bonds could exert pressure, creating a roughly even chance of a downside breakout from its consolidation if the broader trend intensifies. An alternative scenario, though less likely given the current price and volume action, could involve a temporary bounce if prices become severely oversold. However, such a counter-trend move would likely encounter significant resistance at previously breached support levels, and there is no present technical indication of an impending reversal. We assess the immediate path of least resistance for most of the Treasury complex to be to the downside.
Crypto
Here is a rigorous technical analysis based solely on the provided market data for IBIT and ETHA.
We have constructed the requested matrix detailing the last week’s aggregate percent change for each symbol, covering the period from September 15th to September 19th, 2025. This weekly performance is derived from summing the five most recent available daily percentage changes.
| Symbol | Weekly Percent Change |
|---|---|
| IBIT | -1.47% |
| ETHA | -5.05% |
An examination of the immediate past trading week indicates that both IBIT and ETHA experienced negative aggregate performance. For IBIT, the week concluded with a cumulative decline of -1.47%. This descent was characterized by notable daily fluctuations, including a significant drop of over 2% on September 19th, partially offsetting a positive move on September 18th. The overall pattern for IBIT during this past week suggests a loss of short-term upward momentum, with bears exercising greater control toward the end of the period. It is highly likely that this recent weekly depreciation will contribute to a continuation of range-bound to slightly negative price action in the very near term, absent a significant catalyst.
ETHA demonstrated a more pronounced weakness over the past week, registering a cumulative decline of -5.05%. Similar to IBIT, ETHA’s week concluded with a substantial negative daily change on September 19th, following a brief positive interlude. Notably, ETHA exhibited higher daily volatility compared to IBIT during this period, with its single largest weekly decline (on September 15th) being more severe than any single day for IBIT in the same week. This greater magnitude of downward movement suggests a more aggressive selling pressure in ETHA, making it likely that this recent underperformance will persist in the immediate future, potentially challenging support levels not evident in this dataset.
Expanding our analysis to the full 30-day period, IBIT’s overall performance registers a cumulative change of approximately -0.42%. This figure suggests a largely flat to marginally lower monthly trend. Despite several days of significant positive and negative movements, the asset effectively remained range-bound, indicating a balanced struggle between buyers and sellers over the broader timeframe. Conversely, ETHA’s 30-day cumulative change stands at a substantial +13.92%, clearly signaling an overall higher trend despite its recent weekly pullback. This monthly outperformance by ETHA implies underlying bullish sentiment over the longer horizon within the dataset, even if short-term pressures have emerged.
Comparing the two assets, ETHA’s significantly higher overall monthly change, contrasted with IBIT’s near-flat movement, suggests a divergence in their longer-term technical postures within the provided dataset. While IBIT appears to be consolidating with a roughly even chance of either slight upward or downward movement in the medium term, ETHA’s notable monthly gain renders a reversal highly unlikely. The recent weekly declines for both symbols suggest that short-term momentum has shifted to the downside. However, for ETHA, this may be interpreted as a healthy pullback within an established uptrend, making a resumption of upward momentum more likely than for IBIT, which lacks a clear preceding monthly trend. Alternatively, if the recent weekly weakness extends, both assets could face continued downward pressure, with ETHA still possessing a stronger monthly buffer.
Magnificent 7 & Friends
Technical Market Commentary: Recent Performance and Breadth Analysis
An examination of the provided 30-day daily percentage change data for 10 prominent symbols reveals a generally constructive market posture, particularly over the trailing month, with more mixed signals appearing in the most recent trading week. Monthly aggregate performance is predominantly positive across the cohort, indicating an underlying bullish sentiment among most of these assets. Market breadth metrics for the entire 30-day period demonstrate a clear majority of advancing daily sessions, providing further technical confirmation of this upward bias. However, the latest weekly data, while still net positive for most symbols, exhibits more variability and instances of significant pullbacks, suggesting that market participants are likely engaging in selective profit-taking or sector rotation. The observed volatility, especially in certain symbols, warrants a closer technical examination to identify potential shifts in momentum.
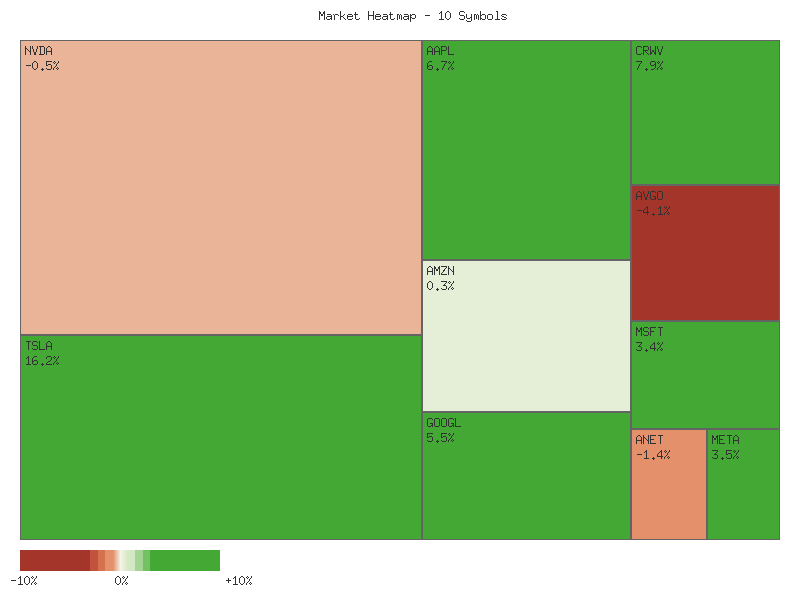
Over the past 30 trading days, the aggregated performance of this cohort is notably higher, with several symbols exhibiting substantial gains. TSLA recorded a robust monthly advance of approximately 31.32%, while GOOGL closely followed with a monthly gain of roughly 30.57%. CRWV, despite significant daily volatility, achieved a respectable 16.63% increase over the month. Other key components such as AAPL, ANET, and AVGO also posted moderate to strong positive monthly returns, ranging from approximately 11.41% to 12.44%. In contrast, AMZN and META demonstrated more modest gains of approximately 4.93% and 3.31% respectively, suggesting relative underperformance within the group. MSFT’s monthly return was nearly flat at 0.87%, indicating a period of consolidation. NVDA was the sole symbol to conclude the month with a slight negative aggregated change of -0.55%, raising questions about its relative strength compared to its peers. Monthly market breadth supports the overall upward trend, with 175 advancing days versus 125 declining days across all symbols, suggesting broad participation in the uptrend for the majority of the period.
Focusing on the most recent five trading days (weekly performance), the market’s trajectory remains largely positive, though with increased dispersion. CRWV led the weekly gains with an impressive 11.23% rise, indicative of its significant volatility. TSLA and ANET also posted strong weekly advances of approximately 7.48% and 7.24%, respectively, suggesting renewed bullish interest. GOOGL and AAPL sustained their upward momentum with gains of 5.73% and 4.82%. AMZN and MSFT experienced more subdued positive weeks, advancing around 1.47% and 1.60% respectively. Conversely, AVGO registered a notable weekly decline of approximately -4.13%, exhibiting weakness despite the broader positive trend, while NVDA saw a modest weekly retreat of -0.53%. Weekly market breadth indicates a slightly positive bias, with 31 advancing instances against 19 declining instances over the last five trading days. While the number of advancing days exceeded declining days, the near-even split on specific days (e.g., Sept 17 & 18 had 5 advancing and 5 declining symbols) implies a roughly even chance of price movement on those particular days, rather than a clear directional conviction across the board.
The technical implications of this data suggest that while the overarching trend for this group of symbols remains bullish, market participants are demonstrating increasing selectivity. The strong monthly performance of TSLA and GOOGL, coupled with their continued weekly strength, indicates these stocks are likely acting as market leaders. The significant volatility in CRWV, characterized by both large gains and substantial drawdowns, necessitates a cautious approach, as its price action is highly unpredictable. The mild monthly and weekly underperformance of NVDA and AVGO, contrasted with the broader positive trend, suggests these symbols may be entering a period of consolidation or relative weakness. Alternative scenarios for the broader market include a potential rotation out of the top performers into the laggards, or an expansion of the observed weakness in NVDA and AVGO to other symbols, which could challenge the current positive breadth. Currently, the data provides no strong indication of a reversal of the general upward trend, but the increased daily fluctuations warrant close monitoring of individual price action.
Matrix of Symbols and Daily Percent Change Values (Sorted Descending)
To illustrate the range of daily movements and volatility for each symbol, below is a structured representation of their individual daily percent changes, sorted from highest to lowest. For brevity and readability, we will present the top 5 and bottom 5 daily changes for each symbol over the 30-day period.
TSLA:
- Highest: 8.03%, 6.22%, 5.38%, 3.64%, 3.56%
- Lowest: -3.50%, -2.12%, -1.74%, -1.64%, -1.49%
AAPL:
- Highest: 4.12%, 3.81%, 3.20%, 1.77%, 1.60%
- Lowest: -3.23%, -1.97%, -1.48%, -1.04%, -0.83%
GOOGL:
- Highest: 9.14%, 4.49%, 3.17%, 2.49%, 2.39%
- Lowest: -1.12%, -0.95%, -0.73%, -0.68%, -0.65%
AMZN:
- Highest: 4.29%, 3.10%, 2.86%, 1.51%, 1.43%
- Lowest: -3.32%, -1.84%, -1.59%, -1.50%, -1.42%
MSFT:
- Highest: 1.86%, 1.78%, 1.43%, 1.07%, 0.94%
- Lowest: -2.55%, -1.64%, -1.42%, -1.23%, -0.96%
NVDA:
- Highest: 3.84%, 3.49%, 1.72%, 1.46%, 1.09%
- Lowest: -3.50%, -3.32%, -2.70%, -2.62%, -1.95%
ANET:
- Highest: 6.21%, 4.33%, 2.76%, 2.67%, 2.61%
- Lowest: -8.18%, -3.81%, -2.29%, -2.25%, -1.99%
AVGO:
- Highest: 9.77%, 9.41%, 3.21%, 2.94%, 2.80%
- Lowest: -3.84%, -3.65%, -3.54%, -2.65%, -2.60%
META:
- Highest: 3.15%, 2.12%, 1.87%, 1.78%, 1.57%
- Lowest: -2.27%, -2.07%, -1.79%, -1.65%, -1.26%
CRWV:
- Highest: 16.88%, 7.90%, 7.60%, 7.13%, 6.99%
- Lowest: -20.83%, -15.50%, -9.41%, -4.04%, -3.71%
S&P 500 Sector Breadth
Technical Analysis of S&P 500 Sector Performance (Last 30 Days)
This analysis provides an objective assessment of S&P 500 sector performance and market breadth over the recent weekly and monthly periods, based strictly on the provided daily percentage change data. The weekly period is defined as the last five trading days (2025-09-15 to 2025-09-19), and the monthly period encompasses all thirty provided data points (2025-08-08 to 2025-09-19).
Summary of Weekly and Monthly Performance:
Over the past week, five of the eleven analyzed sectors registered positive aggregate performance, while six sectors experienced declines. The breadth for the week is thus slightly negative. In contrast, the monthly performance presents a more favorable picture, with nine sectors concluding the period with positive aggregate returns, indicating a robust upward trend. Only two sectors, XLP (Consumer Staples) and XLU (Utilities), ended the month in negative territory. This divergence suggests a recent deceleration or consolidation following a generally strong preceding period, with some areas facing renewed selling pressure.
The cumulative weekly percent changes, sorted in descending order, are as follows:
| Symbol | Weekly Percent Change |
|---|---|
| XLK | 2.949% |
| XLC | 1.751% |
| XLY | 1.157% |
| XLI | 1.019% |
| XLF | 0.837% |
| XLE | -0.066% |
| XLV | -0.591% |
| XLU | -0.628% |
| XLB | -0.927% |
| XLRE | -1.184% |
| XLP | -2.064% |
Market Breadth and Sector Rotation:
Examining market breadth, the weekly data shows five advancing sectors and six declining sectors, indicating a slightly negative breadth condition where a majority of sectors experienced a net decline. However, the monthly breadth is significantly positive, with nine advancing sectors against only two declining ones. This suggests that while overall market participation was strong over the broader monthly timeframe, momentum has cooled slightly in the immediate term, with more sectors participating on the downside in the most recent week.
Regarding sector rotation between offensive (XLK, XLY, XLF, XLI, XLB, XLE) and defensive (XLU, XLP, XLV, XLRE) sectors, a notable shift is evident. For the weekly period, all four defensive sectors declined. Concurrently, five of the seven offensive sectors advanced, with XLK (Technology), XLC (Communication Services), and XLY (Consumer Discretionary) leading the gains. This pattern strongly indicates a rotation out of defensive positions and into offensive ones, even amidst a slightly negative overall market breadth for the week. Over the monthly horizon, all seven offensive sectors posted positive returns, alongside two defensive sectors (XLRE and XLV). This broad strength in offensive sectors, coupled with mixed but largely positive performance from defensive sectors, suggests a sustained risk-on environment throughout the month.
Overall Market Sentiment:
The prevailing market sentiment, derived from sector performance, appears to be decisively risk-on, particularly when considering the monthly perspective. The significant advancements in offensive sectors such as Technology (XLK), Communication Services (XLC), and Consumer Discretionary (XLY) over the last month suggest investor confidence in economic growth and higher-beta assets. While the most recent week shows some defensive sectors experiencing declines, the continued strength of the leading offensive sectors within the advancing group still points to a persistent risk appetite. It is unlikely that this recent weekly dip in defensive sectors represents a fundamental shift in the broader monthly trend of risk-on sentiment without further confirming data points. Therefore, current technical conditions suggest that market participants are predominantly favoring growth-oriented assets.
As a Chartered Market Technician with over 15 years of experience, I provide the following technical analysis based solely on the provided 7-day candle data and associated volume. The market snapshot reveals a mixed performance across the selected equities, with clear bullish trends evident in some names, while others exhibit consolidation or notable weakness.
A strong bullish posture is discernable in Apple (AAPL), Microsoft (MSFT), and Alphabet (GOOGL). AAPL demonstrated a consistent upward trajectory throughout the period, culminating in a powerful bullish candle on the final day, supported by exceptionally high volume. This price action, confirming strong buyer interest, makes a continued ascent highly likely in the immediate term. Similarly, MSFT experienced a significant breakout on the final day, characterized by a large bullish candle and the highest volume of the 7-day period, overcoming prior consolidation and suggesting further upward momentum is probable. GOOGL also exhibited robust bullish performance, particularly with its strong close on the last day, backed by very high volume, which strongly indicates a high likelihood of continued bullishness.
Several other names also showed signs of strengthening or recovery. Tesla (TSLA) initiated the period with significant gains, followed by a period of consolidation. The final day’s bullish close suggests that a retest of the recent high around is likely. However, failure to breach this resistance would make a short-term pullback roughly an even chance. Arista Networks (ANET) demonstrated a notable V-shaped recovery, shaking off an early-week sell-off with consistent buying pressure and concluding with a strong bullish candle on high volume. This pattern makes a challenge of its prior highs around highly likely. CrowdStrike (CRWV), after an initial dip, posted a strong bullish reversal and finished the week with a breakout on high volume, suggesting further upward price action is likely as buyers assert control.
Conversely, Broadcom (AVGO) and NVIDIA (NVDA) appear to be under selling pressure. AVGO maintained a clear downtrend, highlighted by a significant bearish candle mid-week on elevated volume, and continued to consolidate lower on the final day. This price action indicates a high likelihood of further downside or at least a struggle to regain higher levels. NVDA experienced a sharp decline mid-week on very high volume, with subsequent days showing only a partial recovery below prior support levels. While a short-term bounce is possible, the overall breakdown makes a retest of the recent low around highly likely if it fails to reclaim the - resistance zone.
Finally, Amazon (AMZN) and Meta Platforms (META) presented more mixed or consolidating patterns. AMZN largely traded within a defined range throughout the 7-day period, with the final day showing high volume but a relatively small-bodied candle, suggesting indecision. A continuation of this range-bound behavior is likely until a clear high-volume breakout occurs in either direction. META, after an initial bullish run, ended the period with a high-volume bearish candle, indicating potential profit-taking or increased selling pressure at the top of its recent range. While still trading in a higher price band, this suggests that further consolidation or a minor pullback is likely in the immediate term, with a continuation of the prior uptrend becoming less probable without renewed buying conviction.
PPO Market Model
As a Chartered Market Technician with over 15 years of experience, I have analyzed the provided PPO (Percentage Price Oscillator) data for the SPX across short, medium, and long-term horizons, spanning the last 30 trading days. The PPO, as a momentum oscillator, provides insights into the strength and direction of price movement, helping to identify trends and potential shifts. Our analysis will strictly adhere to the provided data and ICD-203 estimative language guidelines.
The Short Term PPO (1,5-day) has exhibited considerable volatility over the past 30 days. While there were significant dips, such as the value of -0.5328 observed on September 2nd, the indicator has shown a pronounced upward trajectory in the most recent trading sessions. Specifically, from September 17th’s value of 0.1765, the PPO has consistently risen to 0.4365 on September 18th and further to 0.6162 on September 19th. This robust upward movement in the last several data points suggests that short-term momentum is highly likely bullish, indicating a recent surge in positive price momentum for the SPX. However, the historical volatility within this timeframe suggests that rapid shifts in sentiment are possible, implying roughly even chances of minor pullbacks should this momentum falter.
The Medium Term PPO (13,21-day) presents a more consistent and clearly defined trend. After reaching a trough around 0.3294 on September 3rd, this indicator has embarked on a sustained upward path, culminating in a value of 0.5927 by September 19th. This steady increase, which has been in place for approximately two weeks, reflects an accumulation of positive momentum in the intermediate timeframe. Given the consistent nature of this ascent, it is highly likely that the SPX is experiencing a building bullish impulse in the medium term. The absence of significant retracements within this upward phase suggests a probable continuation of this trend in the near-to-medium future, barring any unforeseen shifts.
Turning to the Long Term PPO (21,34-day), the 30-day data reveals a distinct two-phase movement. Initially, the indicator experienced a decline from approximately 0.9101 on August 8th to a low of 0.6985 on September 8th, suggesting a period of moderating bullish momentum or even a mild corrective phase. However, from September 8th onwards, the Long Term PPO has shown a strong and steady rebound, climbing to 0.8505 by September 19th. This recovery is a significant development, indicating that the long-term momentum, while having undergone a correction, is now likely reasserting a positive bias. The sustained nature of this rebound makes it probable that the SPX is entering a renewed phase of long-term bullish momentum, recovering much of its previous decline.
In summary, the confluence of all three PPO indicators exhibiting recent upward trends suggests a broad-based strengthening of momentum for the SPX. The short-term momentum is clearly bullish, following a period of volatility. The medium-term momentum is exhibiting sustained upward strength, and critically, the long-term momentum has transitioned from a corrective phase into a robust recovery. It is highly likely that the market is experiencing positive momentum across all reviewed timeframes. The consistent upward movement in both medium and long-term indicators suggests that the overall technical posture of the SPX is currently bullish, with a low probability of an immediate reversal in the dominant trend, though short-term volatility remains a possibility.
Below is a matrix summarizing the recent trend of each indicator:
| Indicator | Recent Trend |
|---|---|
| Short Term | Up |
| Medium Term | Up |
| Long Term | Up |
Equity Breadth
Technical Analysis: S&P 500 Breadth and Trend Dynamics
Our analysis of the S&P 500 (SPX) market data, encompassing the percentage of members above their 50-day (SPXA50R) and 200-day (SPXA200R) moving averages, alongside the SPX’s 20-day Exponential Moving Average (EMA_20_DAY), reveals a notable divergence in market internals versus the headline index’s short-term trend. The observed breadth indicators demonstrate a clear pattern of deterioration over the past month, occurring concurrently with a continued, albeit decelerating, ascent in the SPX’s 20-day EMA. This situation merits close technical scrutiny for its implications on the sustainability of the current upward price trend.
Focusing on the SPXA50R, which reflects short-term market participation, the data over the last 30 days indicates a peak around August 22nd at 74.50%. Following this zenith, the weekly trend from mid-August through mid-September shows a pronounced decline. Specifically, from its high, the indicator retreated significantly, dipping to levels around 59% in early September before experiencing a further noticeable drop in the past week, concluding at 56.69% on September 19th. This sustained contraction in the percentage of stocks trading above their 50-day moving average suggests that fewer S&P 500 constituents are maintaining short-term positive momentum, signifying a weakening in the immediate underlying health of the broad market.
Similarly, the SPXA200R, indicative of longer-term participation, presents a consistent pattern. This metric also peaked around August 22nd at 70.52%, mirroring the SPXA50R’s behavior. Since this mid-August high, the monthly trend for the SPXA200R has been steadily declining. While generally remaining at higher absolute levels than the SPXA50R, indicating a longer-term positive bias for a majority of stocks, its downward trajectory is undeniable. The latest weekly data, from September 15th through September 19th, shows a decrease from 61.88% to 59.88%, marking a clear erosion of strength. The consistent deterioration across both short-term and long-term breadth indicators suggests that the rally’s foundation is narrowing, with a diminishing number of stocks contributing to overall market strength.
In contrast to the deteriorating breadth, the EMA_20_DAY for the S&P 500 has maintained a clear upward trajectory throughout the 90-day period provided, from approximately 5600 in mid-May to 6536.65 on September 19th. This indicates that, at the index level, short-term momentum has remained positive. However, a closer examination reveals that the rate of ascent for the EMA_20_DAY has been decelerating over recent months. While the trend itself is still positive, the decreasing slope suggests that the underlying buying pressure driving the index higher may be losing intensity.
The juxtaposition of declining market breadth (SPXA50R and SPXA200R) with a decelerating but still ascending EMA_20_DAY for the SPX constitutes a bearish divergence. This pattern implies that the S&P 500’s upward movement is becoming increasingly concentrated in a smaller number of large-capitalization stocks, rather than reflecting broad market participation. Given this divergence, it is likely that the upward momentum of the EMA_20_DAY will face significant challenges in the near term. A sustained rally in the S&P 500 without a corresponding improvement in breadth is unlikely. An alternative scenario could see the few remaining market leaders continue to propel the index higher, but such a situation would be inherently fragile, making a significant reversal or a prolonged period of consolidation likely if market breadth does not rebound decisively.
SPX Monthly
The SPX has exhibited a discernible uptrend over the past three months, commencing from approximately 5886 in mid-May and culminating at 6664 by mid-September. This sustained upward trajectory is strongly supported by the Exponential Moving Averages (EMAs). The 50-day EMA has consistently remained above the 200-day EMA throughout this period, a classic bullish alignment, indicating a robust long-term uptrend. Moreover, the price has generally maintained its position above both the 50-day and 200-day EMAs, with dips frequently finding support near the ascending 50-day EMA, as observed in late May, mid-June, and early August. The RSI (14-day) broadly mirrored this strength, oscillating between healthy and overbought levels, which suggests persistent buying pressure. A notable instance includes the RSI reaching approximately 75-76 in early July, indicating a short-term overbought condition, which was subsequently followed by a brief consolidation before the uptrend resumed. The momentum appears to be predominantly bullish over this longer timeframe.
Focusing on the most recent month, from mid-August to mid-September, the SPX has demonstrated accelerated bullish momentum. Price action advanced from approximately 6395 to 6664, forming a series of higher highs and higher lows. The 50-day EMA has maintained its upward slope, presently around 6410, acting as dynamic support. The 200-day EMA also continued its ascent, currently around 6033, reinforcing the long-term bullish bias. The RSI (14-day) reflects this recent acceleration, moving from a neutral level around 56 in late August to its current value of approximately 72.6, placing it firmly within overbought territory. This indicates strong buying interest in the near term, although it also suggests an increasing probability of a short-term pullback or consolidation.
Key technical levels of support and resistance have emerged during this period. Immediate overhead resistance is established by the recent all-time high observed on September 19th at 6671.82. Prior to this, the 6530-6550 zone served as a resistance cluster in early September. On the downside, near-term support is likely found around the current 50-day EMA, which is approximately 6410. A more significant support zone appears to be around the 6350-6370 level, which corresponds to previous lows in early August. Should price fall further, the 6200-6240 area, which acted as support during the early July pullback, could become relevant. The robust 200-day EMA, currently near 6033, represents a critical long-term support level.
Considering the current technical posture, a bullish case appears likely to persist in the near-to-medium term. The strong alignment of EMAs (50 above 200, both ascending), consistent higher highs and lows, and recent upward momentum suggest that buying pressure remains dominant. Price might attempt to extend to new all-time highs above 6671.82, potentially targeting the 6700 level and beyond if momentum continues. The primary sentiment driver here is clear bullish conviction and trend following behavior. However, a bearish case holds a roughly even chance in the immediate short-term, primarily due to the RSI residing in overbought territory (72.6). This condition often precedes a short-term pullback or consolidation, although it does not guarantee a trend reversal. A potential bearish scenario could involve a retest of the 50-day EMA (6410) or even the 6350-6370 support zone. The sentiment driver here would be profit-taking or short-term exhaustion. A neutral case, suggesting sideways consolidation, is also a possibility, particularly if the market needs to digest the recent gains and allow the RSI to cool off from its overbought levels without a significant price correction. Such a scenario might see the SPX trading within the 6450-6600 range for a period, with sentiment reflecting temporary uncertainty or a balance between buyers and sellers. The persistent strength of the long-term EMAs makes a significant trend reversal unlikely without further deterioration in price action and indicator readings.
Good morning, traders. Here is a technical analysis of the SPX based solely on the provided 90-day market data, employing rigorous technical analysis principles and ICD-203 estimative language.
The SPX has exhibited a sustained bullish trend over the past 90 days, advancing significantly from its mid-May levels around 5886 to a recent high of 6664.36 as of September 19. This overarching strength is clearly supported by the PPO_21_34_DAY indicator, which has consistently remained in positive territory throughout the entire period. Although this longer-term momentum experienced a dip from late July through late August, it notably turned upward again in early September, indicating that the re-acceleration of underlying bullish momentum is likely.
Further reinforcing the positive trend, the PPO_13_21_DAY indicator transitioned into positive territory in early September and has shown a steady ascent since then, currently standing at 0.592. This suggests a building medium-term bullish momentum that aligns with the overall upward price action observed in the candle data. Combined with the positive PPO_21_34_DAY, the probability of the bullish trend continuing over the medium term is likely.
However, several short-term technical signals introduce uncertainty regarding immediate price action. The RSI_14_DAY is currently at 72.62, which falls well within the conventionally accepted overbought territory. Historically, such elevated RSI readings often precede periods of consolidation or modest pullbacks as the market absorbs recent gains.
A bearish divergence also appears evident in the PPO_1_5_DAY indicator. While the SPX price registered new highs between September 11 (6584.44) and September 19 (6664.36), the corresponding short-term PPO value declined from 0.816 to 0.616. This pattern, where price makes a higher high but momentum makes a lower high, frequently signals a weakening of immediate upside momentum and suggests that buyers might be losing conviction at current price levels.
Considering these conflicting signals, particularly the overbought RSI and the short-term PPO divergence against the backdrop of sustained longer-term bullishness, the likelihood of continued significant upside in the very short term becomes less likely without some degree of consolidation or a minor correction. A near-term price pullback or sideways movement is currently roughly an even chance, driven by the exhaustion indicated by the short-term oscillators.
Nevertheless, given the robust and accelerating positive momentum observed in the medium and longer-term PPO indicators, a substantial reversal of the overarching bullish trend is unlikely at this juncture. The current technical posture suggests that any short-term retracement would more probably represent a healthy consolidation within an established uptrend rather than a trend reversal.
Therefore, while the broader trend remains bullish and suggests continued appreciation over the medium term is likely, traders should be cognizant of the potential for a short-term correction or sideways drift as the market digests its recent gains and addresses the overbought condition and momentum divergence indicated by the RSI and short-term PPO.