Daily Market Technical Analysis
Daily Market Technical Analysis
Market Overview
The market currently presents diverging technical signals: large-cap indices demonstrate robust upward momentum, particularly within the technology sector, with QQQ probable to continue outperforming SPY short-term. Conversely, small and mid-cap segments are likely experiencing a bearish reversal. While the S&P 500 maintains a strong intermediate-term uptrend (highly likely), its overbought RSI and weakening internal breadth suggest diminishing durability for the current rally, indicating a roughly even chance of short-term consolidation or a modest pullback. In commodities, precious and industrial metals show strong bullish continuation (highly likely), contrasting with likely further downward pressure for energy sectors. Fixed-income demonstrates a preference for shorter-duration assets (likely), as longer maturities encounter plausible headwinds. Overall, market strength appears concentrated amidst underlying breadth weakness, pointing to heightened vulnerability.
Market Indices
Good morning, traders. Let’s delve into a technical analysis of the provided market data, adhering strictly to objective indicators and estimative language.
Here is a summary of the daily percentage change for the selected indices, sorted in descending order:
| Symbol | Daily Percent Change |
|---|---|
| QQQ | 0.6769% |
| OEF | 0.6421% |
| SPX | 0.4885% |
| IWM | -0.7597% |
| MDY | -1.0237% |
| IJR | -1.1357% |
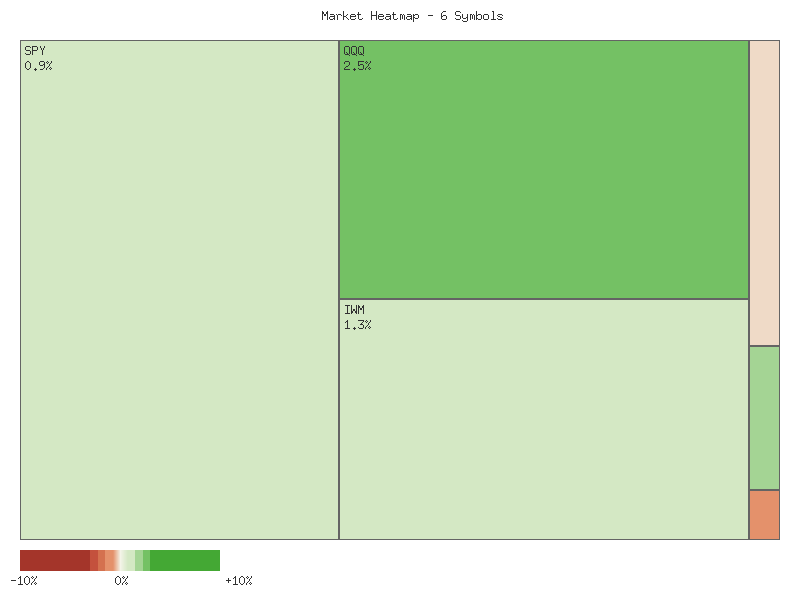
Summing the daily percent changes across these key market proxies yields a cumulative change of approximately -1.11%. This indicates that the market, when viewed through the aggregate performance of these indices, experienced an overall lower trajectory for the session. While the larger-cap indices (QQQ, OEF, SPX) posted modest gains, the negative contribution from mid and small-cap segments (IWM, MDY, IJR) was substantial enough to pull the aggregate value into negative territory. This suggests a roughly even chance that broader market momentum is not uniformly positive, with specific segments exhibiting weakness.
Examining market breadth, we observe three advancing symbols (QQQ, OEF, SPX) and three declining symbols (IWM, MDY, IJR). This even split implies a mixed market breadth, indicating that the session’s movements were not characterized by broad participation on either the upside or downside across the represented capitalization segments. Specifically, the outperformance of large-cap and growth-oriented segments (QQQ, OEF, SPX) against the underperformance of small and mid-cap segments (IWM, MDY, IJR) is noteworthy. This pattern suggests that market leadership is concentrated, which could present challenges for a sustained, broad-based rally. It is likely that this divergence reflects underlying rotations or sector-specific dynamics rather than a unified market direction.
Turning to volatility, the VIX experienced a daily percentage change of -1.59% for the session, closing at 15.45. Reviewing the 7-day candle data for the VIX, we observe that it reached a high of 16.36 on September 16th, followed by a decline to 15.45 by September 19th. Over the entire 7-day period, the VIX ascended from 14.76 to 15.45, experiencing a high of 16.75 on September 17th. The recent daily decline in the VIX, occurring alongside mixed equity performance but with large-caps advancing, suggests a moderate chance of decreasing near-term anxiety among market participants, particularly concerning the larger-cap components. However, the VIX remains above its starting point for the week, which may indicate some underlying apprehension despite the recent daily retreat.
In conclusion, the data presents a picture of a market with diverging performance. The large-cap indices showed resilience, while small and mid-cap indices declined, leading to an overall negative aggregate performance. The equally split market breadth (three advancing, three declining) corroborates this divergence. The daily decline in the VIX, while usually a positive sign for equities, should be considered in context with its prior weekly ascent and the mixed market breadth. Traders should recognize that market strength appears concentrated, and the broader market may face headwinds from segments experiencing declines. It is unlikely that a robust, broad-based uptrend is developing given the current technical landscape.
Market Commentary: Divergent Short-Term Technical Signals Across Market Segments
Analysis of the provided two-day candle data for various market segments reveals a notable divergence in immediate-term price action, suggesting differing short-term directional probabilities across market capitalizations. While some major large-cap indices exhibit signs of continued upward momentum, small and mid-cap segments show indications of a short-term bearish reversal. This analysis is based strictly on the provided open, high, low, close, and volume data from September 18-19, 2025.
The small-cap and mid-cap segments, represented by IJR (iShares Core S&P Small-Cap Growth), IWM (iShares Russell 2000), and MDY (SPDR S&P Midcap 400), exhibit a broadly consistent and concerning pattern over the two-day period. All three ETFs initially posted strong bullish candles on September 18th, closing near their respective highs. However, September 19th saw a significant reversal in these segments. IJR and IWM both gapped up at the open but failed to sustain these gains, closing near their lows for the day and significantly below their prior day’s closes. MDY also experienced a sharp downturn, closing well below its open and significantly beneath its prior day’s close. Notably, volume for IJR and IWM increased on the bearish day, and MDY’s volume slightly increased, lending support to the downward move. This collective price action, particularly the bearish engulfing or dark cloud cover type patterns observed, suggests a likely short-term bearish reversal for these market capitalization groups.
Conversely, the large-cap indices, including SPY (SPDR S&P 500), QQQ (Invesco QQQ Trust), and OEF (iShares S&P 100), presented a more resilient picture. Following somewhat indecisive or mildly bullish candles on September 18th, all three indices recorded bullish candles on September 19th, closing higher than their respective opens and, crucially, higher than their previous day’s closes. QQQ, representing the technology-heavy Nasdaq 100, demonstrated particularly strong bullish momentum, making a new two-day high and closing above the psychological 600 level. SPY also registered a higher close with a slight uptick in volume. While OEF showed clear bullish price action with a new two-day high, its volume significantly decreased on the bullish day, suggesting a potential lack of strong conviction behind the move, although the upward momentum is evident. Therefore, these patterns collectively suggest a likely continuation of short-term upward momentum for the large-cap segments, albeit with varying degrees of conviction based on volume.
The contrasting performance across market capitalizations indicates that the broader market is unlikely to be moving in a unified direction in the immediate term. It is likely that small and mid-cap segments will experience further downside pressure in the very short term, with potential resistance levels forming near their September 19th opens/highs (e.g., IJR ~120.96, IWM ~245.57, MDY ~604.69). Simultaneously, large-cap indices appear to be consolidating or attempting to extend gains, with resistance for QQQ near 600.05 and SPY near 664.89. The divergence itself creates uncertainty for the aggregate market direction; it is a roughly even chance that large-cap strength could pull up smaller caps, or that small-cap weakness could eventually weigh on large caps. A scenario where large-caps continue to ascend while small-caps correct appears probable given the two-day data. Traders should observe whether the bearish reversals in small and mid-caps develop into sustained downtrends or are quickly bought, and if the large-cap uptrend can maintain momentum on robust volume.
SPX Technical Analysis: Momentum Strong, Overbought RSI Signals Caution
Over the past 90 days, the S&P 500 (SPX) has demonstrated a sustained intermediate-term uptrend, characterized by a series of higher highs and higher lows. The price action commenced in May with a solid advance, encountered a brief pullback in late May, and then resumed an upward trajectory through June and mid-July. A more pronounced consolidation phase occurred from late July into early August, which ultimately served as a base for the current leg higher. The SPX is presently trading at the upper bound of its observed 90-day range, having established a new high at the close of 6664.36 on September 19th. The overall price structure indicates that the intermediate-term trend is highly likely to remain upward.
Analysis of the 14-day Relative Strength Index (RSI) provides important insights into momentum conditions. In the initial phase of the 90-day period, the RSI moved into overbought territory above 70 in May, subsequently preceding a short-term price deceleration and minor correction. Similarly, in late June and mid-July, the RSI again surged above 70, peaking near 76.29, which was then followed by a more significant price pullback in late July and early August, driving the RSI down to 47.80. As of September 19th, the RSI is once again registering an overbought reading of 72.62. This historical pattern suggests that a short-term price consolidation or a minor pullback in the SPX is likely in the near term.
The Price Percentage Oscillator (PPO) for the 13-21 day periods offers confirmation of the underlying trend and momentum. Early in the 90-day window, the PPO was positive and rising, affirming the bullish price action. Although it dipped towards the zero line in late May and briefly crossed below it around August 1st during the most recent price correction, it promptly reversed course. The PPO has subsequently re-crossed above the zero line in late August/early September and is currently trending upward with a positive value of 0.592. This upward trajectory and positive reading on the PPO indicate robust bullish momentum and suggest that the underlying strength in the SPX is likely to persist.
Synthesizing these indicators, the SPX demonstrates a compelling intermediate-term bullish posture, strongly supported by positive and rising PPO readings. However, the current overbought status of the 14-day RSI presents a near-term cautionary signal, given its historical correlation with subsequent price pullbacks within this specific 90-day dataset. It is likely that we will observe some degree of price consolidation or a modest correction in the short term. An alternative scenario, where the robust momentum propels prices higher despite the overbought RSI, remains a roughly even chance. Should a pullback materialize, prior resistance levels in the 6450-6500 range, which have been overcome, would likely act as immediate support, indicating any such correction would be an opportunity for trend continuation rather than a reversal.
Here is a technical analysis of QQQ over the past 90 days, drawing solely from the provided price and indicator data.
Over the past 90 days, QQQ has exhibited a discernible bullish trend, ascending from approximately in mid-May to nearly by mid-September. This upward trajectory has been punctuated by periods of significant rallies followed by sharp, high-volume pullbacks and consolidations. Notably, initial strength in May saw QQQ push higher, a move characterized by an RSI 14-day consistently above 70, signaling overbought conditions. A subsequent price correction and period of consolidation around late May to early June allowed the RSI to cool down into the mid-60s, a pattern that is often observed after extended rallies. The PPO (13,21-day) indicator initially confirmed robust bullish momentum, peaking around 1.91 in late May, but then experienced a decline into late June despite the price maintaining a generally upward bias, suggesting a potential underlying weakening of momentum.
A more significant inflection point occurred around late July and early August. Following a sustained rally in July where the RSI again pushed above 70, peaking at 73.11 on July 28, QQQ experienced a sharp and high-volume decline. The significant bearish candles on July 31 and August 1, coupled with unusually high trading volumes (64 million and 69 million respectively), suggest a powerful shift in sentiment during that period. The RSI plummeted from overbought levels to 48.26 on August 1, indicating a rapid erosion of buying pressure. Concurrently, the PPO declined sharply, bottoming around 0.50 in early August, corroborating the loss of bullish momentum.
Following the early August downturn, QQQ staged a recovery attempt, which saw the PPO rebound from its lows and the RSI move back into the mid-60s. However, this recovery was met with another period of weakening momentum from mid-August to early September. During this phase, QQQ price consolidated at elevated levels, yet the PPO steadily declined from 0.73 to a low of 0.17 by September 3. This distinct pattern of PPO showing lower highs and then lower lows while the price action was largely horizontal or showing minor new highs represents a notable bearish divergence in momentum, suggesting that the underlying buying pressure was weakening despite the price holding relatively firm.
Presently, QQQ is in a robust rally phase since early September, making consistent new highs and closing near daily highs. The RSI has surged back into deeply overbought territory, currently registering at 73.66 on the final data point of September 19. This level, historically, has often preceded either a price pullback or a period of sideways consolidation. The PPO (13,21-day) has also confirmed this recent acceleration in bullish momentum, rising sharply from 0.17 to 0.73, indicating a strong positive trend. Given the high RSI, it is likely that the current upward price action is extended, suggesting that continued aggressive upward movement without some form of consolidation or retracement is improbable in the immediate term. While the strong PPO indicates robust momentum, the overbought RSI signals a roughly even chance of either a continued, albeit possibly slower, ascent, or a short-term price correction to alleviate the buying pressure. Traders should be vigilant for signs of momentum deceleration, such as a downturn in the PPO or a bearish candlestick pattern, which would likely precede a more significant pullback from these elevated levels.
Market Commentary: IWM Technical Analysis
The Invesco Russell 2000 ETF (IWM) has exhibited a pronounced bullish trend over the analyzed 90-day period. Price action reveals a consistent pattern of higher highs and higher lows, climbing from approximately in mid-May to recent highs near in mid-September. Key rallies were evident from late May into early July, and again from early August to the present. While the trend is clearly defined upwards, intermittent pullbacks, such as the one in late July/early August where IWM declined from to on elevated volume, indicate periods of profit-taking or sentiment shifts. Volume spikes, notably on August 1st (63.8 million shares) and September 17th (79.8 million shares), suggest significant institutional activity or increased market interest around these price movements. The current price stands near its 90-day peak, maintaining the established upward channel.
Analyzing the 14-day Relative Strength Index (RSI), we observe that momentum frequently propelled IWM into overbought conditions (above 70), particularly on July 3rd (71.57) and September 18th (71.23). While these readings confirm strong buying pressure during these rallies, a notable bearish divergence has become apparent. Specifically, as IWM recorded a higher price high on September 18th at .84, the RSI failed to register a significantly higher corresponding peak, showing a reading of 71.23, which is slightly below the July 3rd peak of 71.57 when price was considerably lower at .08. This divergence suggests a weakening in the internal strength of the rally, implying that fewer participants or less conviction is driving the latest price advances.
Further corroborating this shift in momentum is the behavior of the Percentage Price Oscillator (PPO) with 13 and 21-day periods. The PPO has largely sustained positive readings since early August, confirming the prevailing bullish trend. However, a distinct bearish divergence is evident when comparing its peaks against the price action. The PPO recorded a peak of 1.17 on July 10th, followed by a lower high of 1.01 on August 29th, and a further lower high of 0.95 on September 18th. Concurrently, IWM’s price continued its upward ascent, achieving successively higher highs of .80, .17, and .84, respectively. This pattern signals a deceleration in the rate of price change, even as the asset’s price continues to rise, indicating diminishing upward momentum.
In conclusion, while IWM remains in a clear technical uptrend, the combined bearish divergences identified in both the 14-day RSI and the PPO (13,21-day) are significant technical warnings. These divergences indicate that the underlying buying momentum that fueled previous stages of this rally is likely decelerating. Therefore, a continuation of the rapid price appreciation witnessed recently is unlikely in the immediate term. There is a roughly even chance that IWM will experience a period of consolidation or a moderate pullback from current levels. Alternatively, should the price break decisively above recent resistance with a renewed surge in both RSI and PPO to new confirming highs, the existing bullish trend could be re-energized. However, absent such confirmation, the present technical posture suggests increased vulnerability to a loss of upward velocity.
Tech Sector Analysis
As a Chartered Market Technician with over 15 years of experience, I’ve analyzed the provided market data for the RATIO:QQQ/SPY over 14-day and 30-day periods to assess the relative performance of the technology-heavy NASDAQ-100 (QQQ) against the broader S&P 500 (SPY). This analysis relies solely on the provided technical data, utilizing rigorous principles of trend identification and probabilistic assessment.
Our technical analysis of the QQQ/SPY ratio, spanning both 14-day and 30-day periods, offers insights into the relative performance of the technology-heavy NASDAQ-100 versus the broader S&P 500. Over the past 30 days, the ratio has exhibited a “sideways” trend with “weak” strength, reflecting a marginal overall change of just 0.148% from its starting point. Despite this broader lack of robust directional conviction, the current ratio of 0.9030435437697755 sits precisely at the high point for this entire 30-day observation window, signaling a recent strengthening of QQQ’s performance against SPY.
Zooming into the more recent 14-day period, a clearer, albeit still “weak,” “up” trend is evident. This shorter-term analysis reveals a more pronounced positive shift, with the ratio increasing by 2.22% from its starting value to its current level. The current ratio of 0.9030435437697755 not only marks the high for the 30-day period but also for this more recent 14-day period. This confluence of highs indicates that QQQ has definitively gained relative ground against SPY in the immediate past, pushing its comparative valuation to the upper bound of recent trading activity.
Synthesizing these observations, the technical data strongly suggests that the NASDAQ-100 has demonstrated recent outperformance. Given the established upward trend over the last 14 days and the current ratio residing at the highest point of both observed periods, it is likely that QQQ will continue to exhibit outperformance relative to SPY in the immediate short term. This assessment is based on the momentum evident in the shorter timeframe driving the ratio to its peak. However, the recurring designation of “weak” strength across both the 14-day upward trend and the 30-day sideways trend introduces a critical caveat. This weakness implies that while the direction is positive, the underlying conviction or acceleration behind this outperformance is not overwhelmingly robust.
Consequently, while continued outperformance in the very near term is likely, a sustained, aggressive acceleration in QQQ’s relative strength beyond its current peak is assessed to have a roughly even chance. The weak trend strength suggests that this current high could represent an area of resistance, or at least a point where momentum might decelerate. An alternative, plausible scenario is a consolidation phase or a moderate retracement towards the 30-day average ratio of 0.8924449, as the market digests the recent gains without strong follow-through momentum. A significant and rapid underperformance by QQQ, causing a sharp decline in this ratio from its current high, is deemed unlikely given the established short-term upward trajectory.
As a CMT with over 15 years of experience, this analysis focuses exclusively on the provided 90-day technical data for the QQQ/SPY ratio, adhering strictly to ICD-203 estimative language guidelines.
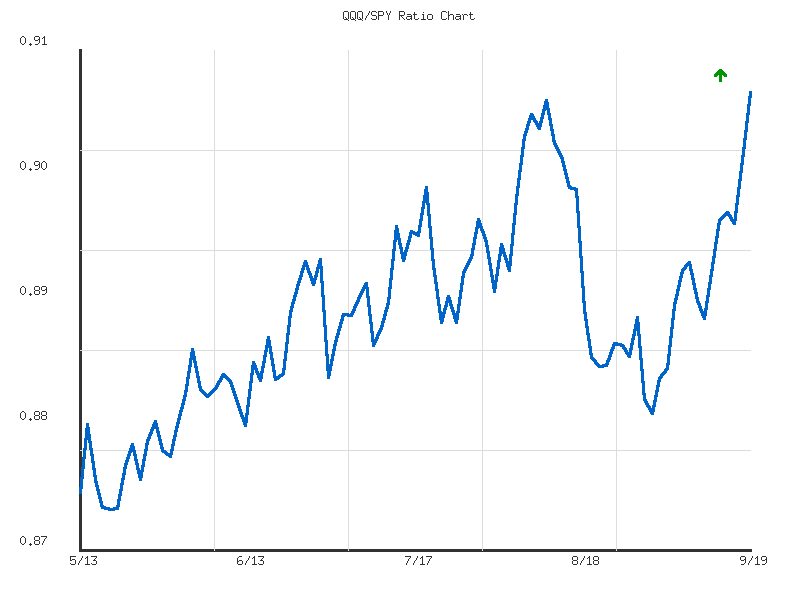
Over the past 90 days, the QQQ/SPY ratio has exhibited a clear upward trend, moving from an initial value around 0.878 in mid-May to a high of 0.903 by mid-September. This upward trajectory indicates that the Nasdaq 100 (QQQ) has been steadily outperforming the S&P 500 (SPY) during this period. Although the overall trend strength is characterized as “weak” with a 2.78% change over the entire 90 days, the consistent climb suggests a persistent, albeit gradual, rotation or strength towards growth-oriented or technology stocks relative to the broader market. This sustained outperformance is a key technical takeaway from the provided dataset.
A closer examination of the ratio’s price action reveals several distinct phases. From mid-May to early June, the ratio established a foundational support area around 0.8775, demonstrating resilience against minor pullbacks before initiating a more defined upward leg. This initial consolidation around the low point (0.8775 on 2025-05-19) formed a base for the subsequent advance. The ratio then progressed through June and July, largely trading within a defined range before breaking out more definitively in August and September. The current ratio of 0.9030 represents the highest point within this 90-day window, signaling a breakout to new relative highs for the period.
The low volatility of 0.0000364 observed throughout this period suggests that the gains in the QQQ/SPY ratio have been achieved through relatively controlled, incremental advances rather than sharp, volatile swings. This characteristic often accompanies sustained trends, as it indicates a lack of significant indecision or erratic price behavior. The fact that the ratio is presently at its 90-day peak (“relative_position: 1”) implies strong recent momentum, even if the overall trend for the entire period is labeled as “weak” in terms of its percentage change. The combination of sustained upward movement and low volatility tends to reinforce the underlying direction.
Considering these technical observations, we judge that a continued outperformance of QQQ relative to SPY is likely in the immediate future, given the breakout to new 90-day highs and the sustained upward trend. While the overall “weak strength” description might imply slower progress, the current momentum to the highest point suggests prevailing bullish sentiment for QQQ relative to SPY. However, a minor consolidation or a retest of recently established breakout levels (perhaps around the 0.895-0.900 area) is a roughly even chance scenario following such an extended move to new highs. A significant reversal of this trend, leading to QQQ underperforming SPY, appears unlikely without a clear technical breakdown below prominent support levels or a sustained period of bearish divergence, neither of which is present in the provided data.
IWM vs. SPY
As a Chartered Market Technician with over 15 years of experience, I offer the following analysis of the IWM/SPY ratio, focusing exclusively on the provided technical data and adhering to ICD-203 estimative language guidelines. This ratio serves as a crucial gauge of relative strength, with an ascending trend indicating outperformance by the small-cap Russell 2000 (IWM) relative to the large-cap S&P 500 (SPY), often associated with technology-heavy constituents. A declining ratio, conversely, points to large-cap outperformance.
Over the past 30 trading days, the RATIO:IWM/SPY:30days data reveals a clear “up” trend with “moderate” strength. This period saw the ratio increase by a notable 5.88%, moving from a low of 0.34577 recorded on August 8th to its current value of 0.36610. The ratio touched a high of 0.36970 on September 18th. Significantly, the current ratio is positioned well above its 30-day average of 0.36040, reflected by a relative position of 0.8494 within its range. This sustained upward trajectory provides a strong technical indication that the broader market, represented by the Russell 2000, has been likely outperforming the S&P 500 during this monthly timeframe.
In contrast, the near-term technical picture presented by the RATIO:IWM/SPY:14days is characterized by a “sideways” trend of “weak” strength. Over the last two weeks, the ratio has experienced only a marginal change of 0.21%. While the current ratio of 0.36610 remains slightly above its 14-day average of 0.36448, its relative position of 0.5844 suggests a leveling off from the stronger momentum observed over the longer period. The recent price action includes the high of 0.36970 on September 18th, followed by a minor dip to 0.36610 on September 19th. This pattern suggests that the previous outperformance by small-caps has entered a phase of consolidation or indecision.
Synthesizing both timeframes, the overarching technical assessment suggests a recent period of small-cap outperformance that has now entered a consolidation phase. The moderate upward trend over the 30-day period establishes a bullish bias for small-cap relative strength. Although the 14-day sideways movement indicates a pause, it does not make a complete reversal of the prior trend unlikely. Instead, given the underlying 30-day momentum, it is probable that this sideways movement represents a natural consolidation within the broader upward trend. For relative small-cap strength to reassert decisively, a sustained break above the recent high of 0.36970 would be required. Conversely, a breakdown below the 14-day low of 0.36103 would elevate the probability of increasing large-cap outperformance. For the immediate future, it remains a roughly even chance that the ratio could continue in a sideways fashion, reflecting a temporary balance in relative market strengths.
Here is a technical analysis of the IWM/SPY ratio based solely on the provided 90-day market data:
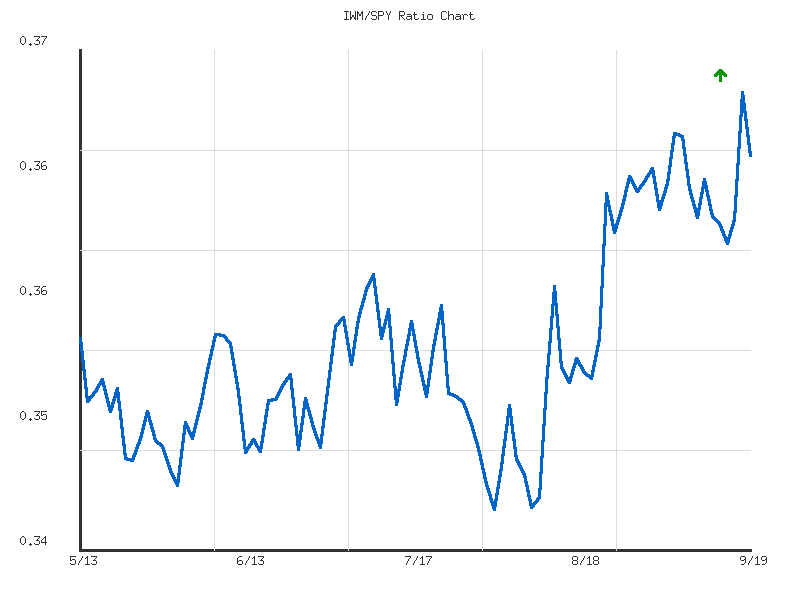
The IWM/SPY ratio, observed over the past 90 days, exhibits a weak upward trend, signaling a modest relative outperformance of small-cap stocks (IWM) against large-cap stocks (SPY). Starting around 0.3555 in mid-May, the ratio closed near 0.3661 by mid-September, marking an approximate 2.98% increase. This positive change, however, is qualified by the “weak” trend strength, implying that while the direction is upward, it has been characterized by oscillations rather than a sustained, aggressive rally. The average ratio for the period stands at approximately 0.3549, with a notably low volatility of 0.000034. This low volatility supports the assessment of a gradual, gentle ascent in relative strength. Currently, the ratio is positioned high within its 90-day range, at roughly 85%, suggesting recent momentum favors IWM relative to SPY.
Analysis of the ratio’s price action reveals critical technical levels. A significant support zone for the IWM/SPY ratio is evident in the 0.345-0.347 range. This area was robustly tested and held on multiple occasions, including the 90-day low of 0.345686 recorded on August 1st and near the beginning of June. A decline to this level would likely encounter strong buying interest, serving as a key area for potential stabilization in relative small-cap performance. On the resistance side, the ratio initially faced hurdles around 0.359-0.360 in early July. This resistance was subsequently broken in mid-August. More recently, the ratio established a new 90-day high of 0.3697 on September 18th, which now represents an immediate overhead resistance level.
The trajectory of the ratio from early August demonstrates a more assertive upward push, culminating in the recently established 90-day high. This acceleration suggests that IWM has been likely outperforming SPY with increased conviction in the later part of the measurement period. The move to 0.3697 signifies a breakout from previous consolidation. However, the immediate minor pullback to 0.3661 on the final data point could indicate a temporary pause, such as profit-taking or an exhaustion of immediate buying pressure. For the relative outperformance of IWM to continue, a decisive and sustained break above the 0.3697 resistance is required, which would make further upside likely.
Conversely, a failure of the ratio to convincingly surpass the 0.3697 resistance, followed by a sustained move below key minor support levels (e.g., around 0.362-0.364), presents an alternative scenario. In this instance, there is a roughly even chance the ratio will enter a period of consolidation or experience a temporary reversal, potentially retesting the previously broken 0.359-0.360 area. Should the ratio drift further back towards the 0.350-0.355 range, it would signal a significant weakening of the recent relative strength, making continued strong outperformance of IWM over SPY in the immediate term unlikely. The next few sessions will be critical in determining whether the momentum behind small-cap relative strength can be sustained.
Commodities
Market Technical Commentary
Below is an analysis of the provided daily percent change data for a selection of commodity-related Exchange Traded Funds (ETFs) and the relative performance of gold and silver.
| Symbol | Daily Percent Change |
|---|---|
| SLV | 2.764% |
| GLD | 1.061% |
| CPER | 0.847% |
| CORN | 0.000% |
| UNG | -0.789% |
| DBC | -0.802% |
| USO | -1.566% |
| UGA | -2.268% |
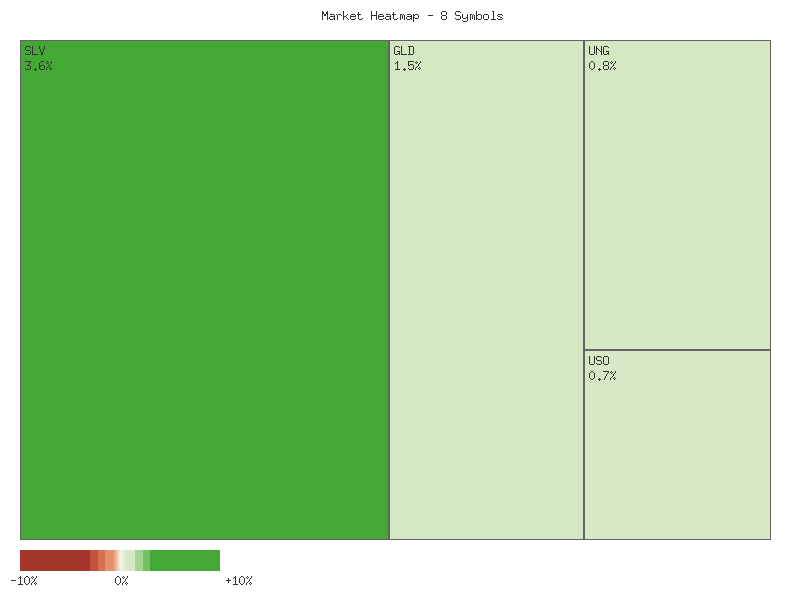
On the observed day, the market for this specific set of commodity-related ETFs appears mixed, with a slight upward bias overall. The sum of the daily percentage changes across all eight symbols amounts to approximately +0.845%, indicating a marginally higher collective performance. However, this modest aggregate gain obscures a noticeable divergence in individual asset performance. Silver (SLV) demonstrated significant strength, leading the advances, followed by Gold (GLD) and Copper (CPER). Corn (CORN) remained flat, registering no change for the day.
Market breadth for this specific group of symbols points to a slight negative inclination. Four symbols (UNG, DBC, USO, UGA) declined, while three symbols (SLV, GLD, CPER) advanced, and one (CORN) remained flat. This configuration suggests that selling pressure was somewhat more prevalent than buying interest across the aggregate, despite the net positive sum of changes. The declines in natural gas (UNG), broad commodities (DBC), crude oil (USO), and agriculture (UGA) indicate specific areas of weakness contrasting with the strength observed in precious and industrial metals.
Reviewing the GLD/SLV ratio over the 14-day period reveals a “sideways” trend with “weak” strength. Despite this, the current ratio of 8.688 represents the low point for this specific 14-day window, following a change of -0.869%. This pattern suggests a recent, albeit weak, shift in relative momentum favoring silver (SLV) over gold (GLD) in the short term. The ratio’s decline to its period low implies that SLV has been outperforming GLD during the latter part of this short-term horizon, and a continuation of this relative strength is likely in the immediate future.
Extending the analysis to the 30-day GLD/SLV ratio, a more pronounced trend emerges. The ratio is in a “down” trend with “moderate” strength, experiencing a -3.198% change over the period, also concluding at its low point of 8.688. This consistent downtrend across both timeframes, culminating in the current ratio being the lowest observed in both the 14-day and 30-day periods, strongly suggests that silver is exhibiting sustained relative strength against gold. Absent other technical indicators or reversals, a continuation of silver’s outperformance relative to gold is likely in the near-to-mid term. It is unlikely that gold will immediately reverse this established trend of underperformance against silver without a preceding period of consolidation or a clear technical pattern signaling such a shift.
As a CMT with over 15 years of experience, my analysis of the provided two-day market data reveals a striking divergence in technical sentiment across the monitored commodity-linked ETFs. Precious metals and industrial metals demonstrated robust bullish characteristics, standing in sharp contrast to the significant bearish price action observed in the broader commodity and energy sectors. This bifurcation suggests that specific sector-driven technical dynamics are presently exerting more influence than any unified commodity market trend.
Precious metals funds, SLV (silver) and GLD (gold), exhibited pronounced bullish momentum during this period. SLV formed two strong bullish candles, notably gapping up on the second day with a substantial increase in volume (more than doubling compared to the previous day). This decisive price action, closing near the day’s high, makes a continuation of the upward trajectory highly likely. Similarly, GLD presented a significant bullish candle on its second day, characterized by a gap up and a strong close near its high, supported by slightly increased volume. This pattern reinforces a high likelihood of sustained buying interest in gold. CPER, representing industrial copper, also displayed consistent bullish price action over both days, with higher highs, higher closes, and slightly increasing volume, suggesting its upward trend is likely to persist in the immediate term. The coordinated strength in these metal categories implies a shared bullish technical driver.
Conversely, the energy complex experienced considerable selling pressure. USO, tracking crude oil, displayed two consecutive bearish candles, including a significant gap down on the second day, accompanied by a notable increase in selling volume. This combination of price action and volume suggests a continuation of the bearish trend is highly likely. DBC, a broad commodity index, also confirmed bearish sentiment with two red candles, featuring a gap down on the second day and closing near its low on slightly increased volume, indicating a high likelihood of further downside. UGA, linked to gasoline, mirrored this weakness with a strong gap down and a significantly lower close on the second day. While the volume on UGA decreased on the second bearish day, the severity of the price action still renders a continuation of selling pressure likely in the very short term, although there is a roughly even chance of a brief pause or minor retracement before further directional movement due to the volume decline.
UNG, representing natural gas, exhibited initial strong bearishness followed by a gap down on the second day. However, despite the gap, it managed to close above its daily low, and volume decreased from the previous day. This price action, combined with reduced volume, suggests the immediate selling intensity may be moderating. Consequently, there is a roughly even chance of either continued downside pressure or a short-term consolidation phase as buying interest may be emerging. For CORN, the first day closed bearishly at its low. The second day, while volatile internally, ultimately closed at the exact same price as the previous day, on lower volume. This indecisive close at a prior support level, coupled with declining volume, implies a roughly even chance for either a breakdown below this level or a period of temporary equilibrium as buyers and sellers seek balance.
Technical Analysis of SLV (90-Day View)
SLV has exhibited a discernible and robust upward trend over the past 90 days, characterized by a series of higher highs and higher lows, as observed from the candlestick data. The rally gained significant traction in early June, pushing prices notably higher, a pattern that largely recurred in July and again with marked strength in late August through mid-September. Trading volume generally escalated during these pronounced upward moves, particularly on days with significant price advancement, suggesting underlying conviction in the bullish sentiment. The most recent price action indicates SLV reached a new high of .04 on September 19th, underscoring the persistence of this uptrend.
Momentum indicators strongly corroborate this bullish trajectory. The Percentage Price Oscillator (PPO) has consistently remained in positive territory throughout much of the 90-day period, indicating that the shorter-term moving average is persistently above the longer-term moving average, a hallmark of an uptrend. While there were periods where the PPO declined (e.g., late June/early July and late July/early August), it stayed above the zero line, signaling that bullish momentum, though tempered, was not entirely extinguished. The PPO has shown strong upward acceleration since mid-August, reaching a peak around 1.69 on September 16th and currently standing at 1.58. This indicates that current positive momentum is substantial and has been a driving force behind the recent price appreciation.
The 14-day Relative Strength Index (RSI) provides further insights into the market’s internal strength. The RSI entered the overbought region (above 70) multiple times, specifically in June, July, and most notably in the recent September rally. On September 15th, the RSI reached a high of 75.38, and its latest reading is 70.11. Persistent readings above 70 indicate a very strong bullish trend. However, they also suggest that the asset may be due for a period of consolidation or a modest pullback to alleviate these extended conditions. Historically, assets often experience some form of retrenchment when the RSI remains deeply overbought for an extended duration.
Considering the combined technical picture, it is likely that SLV will continue to exhibit upward pressure in the near term, given the sustained positive momentum as reflected by the PPO and the robust price action. However, the consistently overbought RSI readings present a roughly even chance of a short-term price consolidation or a minor pullback in the immediate future to relieve the current buying pressure. While no bearish divergences are clearly evident in the provided data (RSI and PPO highs largely correspond with price highs), the high RSI values suggest that a period of sideways movement or a minor correction would not be unexpected, even within the context of a strong overarching uptrend. A significant reversal of the established uptrend is unlikely based solely on the current technical data without further evidence of momentum breakdown or price structure deterioration.
Technical Analysis of GLD - Short to Medium Term Outlook
GLD has experienced a significant uptrend over the past month, marked by robust price appreciation and strong momentum, which followed a period of consolidation and a prior correction. From late August to mid-September, GLD rallied notably from the - region to a recent high near .59 on September 16. This upward movement was accompanied by generally elevated trading volumes, lending credibility to the strength of the breakout. The Relative Strength Index (RSI_14_DAY) confirmed this momentum, moving from neutral territory (around 48-55 in late August) well into overbought conditions, peaking near 79.21 on September 16. Similarly, the Percentage Price Oscillator (PPO_13_21_DAY) crossed above the zero line in late August and surged dramatically, reaching a peak of 1.447 also on September 16, signaling an intense acceleration of bullish momentum.
In the immediate short term, the technical indicators suggest that GLD is experiencing a cooling period after its rapid ascent. Since reaching its peak on September 16, the price has shown a minor pullback, with closes at .97 and .62 on September 17 and 18, respectively, before a rebound to .18 on September 19. Concurrent with this price action, the RSI has retreated from its extreme overbought reading of 79.21 to 72.61 by September 19. While still firmly in overbought territory, this decline indicates a likely reduction in buying pressure or profit-taking. The PPO also reflects this deceleration, having pulled back from its peak of 1.447 to 1.329. This pattern, where both momentum indicators retreat from extreme levels, even if still positive, is often observed after a substantial rally.
Considering these developments, it is likely that GLD will undergo further consolidation or a shallow pullback in the immediate future. The RSI, although lower, remains above 70, suggesting that the underlying bullish sentiment is still strong, but the intensity of the rally is diminishing. A sustained move below the 70 level for the RSI would suggest a higher probability of deeper short-term corrections. The PPO’s slight decline from its peak, even with a strongly positive value, indicates a decreasing rate of price increase. The immediate resistance is observed near the recent high of .59.
Looking ahead, a notable shift in momentum would be signaled by the PPO crossing below its implied signal line (not explicitly provided, but suggested by the peak and subsequent decline) or, more significantly, a move back towards the zero line. Conversely, a renewed surge in the PPO, especially if accompanied by the RSI re-approaching or exceeding its prior highs, would indicate a likely resumption of the strong uptrend. Given the current data, there is a roughly even chance of either a continued modest consolidation or a retest of the recent highs in the next several sessions, depending on whether the bullish momentum can re-accelerate from its current elevated, yet decelerating, state. A more substantial correction is unlikely unless the RSI drops significantly below 60 and the PPO begins a clear descent toward the zero line.
Bonds
As a Chartered Market Technician with over 15 years of experience, I’ve analyzed the provided daily percentage change data for several fixed-income exchange-traded funds (ETFs) using rigorous technical analysis principles.
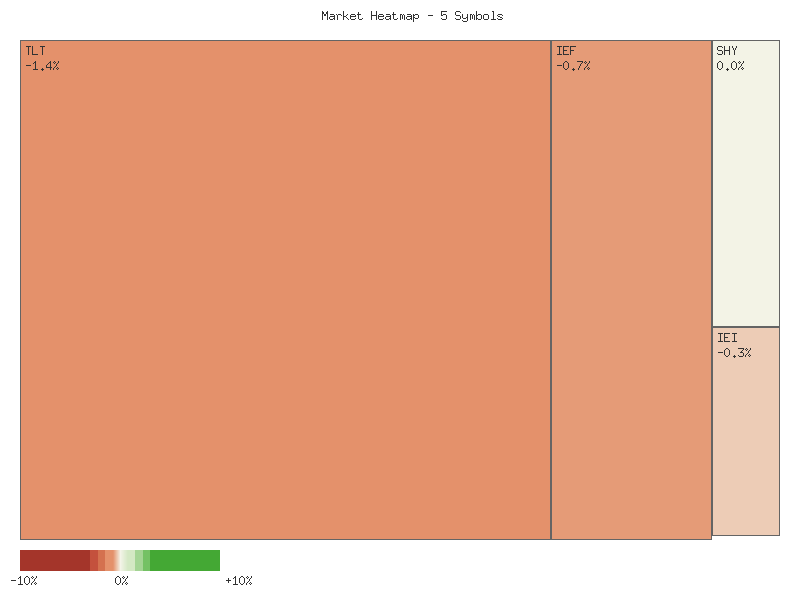
Our technical analysis of the provided fixed-income ETFs for the most recent daily period reveals a mixed yet predominantly negative performance across the duration spectrum. The following matrix presents the daily percent changes, sorted in descending order:
| Symbol | Daily Percent Change |
|---|---|
| SHY | 0.036% |
| IEI | -0.008% |
| IEF | -0.041% |
| UTHY | -0.150% |
| TLT | -0.191% |
This data indicates that out of the five observed instruments, only one registered an advance, while the majority experienced declines. The range of performance spans from a modest gain in SHY to a more significant decline in TLT.
Aggregating the daily percentage changes across all five symbols yields a total decline of approximately -0.355% (-0.191% + -0.150% + -0.041% + -0.008% + 0.036%). This net negative sum strongly suggests an overall bearish sentiment for this specific basket of fixed-income assets during the observed period. Regarding market breadth, the ratio of declining to advancing symbols stands at 4:1. This overwhelmingly negative breadth, where only 20% of the observed instruments advanced, is a clear technical indicator of broad weakness within this segment for the day. While the magnitude of the aggregate decline is relatively small, its pervasive nature across most symbols is noteworthy.
A closer examination of the data reveals a discernible pattern correlated with duration. The longest-duration instruments, TLT and UTHY, experienced the most significant percentage declines, registering -0.191% and -0.150% respectively. Conversely, the shortest-duration instrument, SHY, was the sole advancer at +0.036%. Intermediate-duration bonds (IEF, IEI) posted modest declines. This distribution of performance strongly suggests a preference for shorter-duration assets or a general de-risking from duration exposure during this period. The positive performance of SHY amidst broad declines in longer-duration counterparts represents a noteworthy technical divergence, implying a likely short-term rotational flow within the fixed-income market, favoring the very short end.
Based strictly on this single day’s technical data, we assess that the observed market action probably reflects a modest repricing of interest rate expectations, primarily impacting longer maturities, or a tactical shift in investor positioning away from duration risk. While one day of data provides limited scope for robust predictive analysis, the broad negative breadth combined with the duration-specific performance makes it plausible that longer-duration instruments may encounter continued headwinds in the immediate short term. Conversely, shorter-duration assets might exhibit relative stability or even minor positive momentum. An alternative scenario, though less likely given the consistent duration-based pattern, is that the declines represent routine profit-taking after prior unobserved advances, without a fundamental shift in duration preference. However, without additional historical data or other technical indicators, we are unable to ascertain the probability of such an alternative with greater precision.
This technical analysis of the provided 2-day market data for TLT, UTHY, IEF, IEI, and SHY reveals a distinct divergence in price action across various durations within the bond ETF landscape. Longer-term treasury ETFs exhibit a bearish bias, intermediate-term instruments show consolidation, and shorter-term bonds demonstrate stability or a slight upward tilt. All observations are strictly based on the provided Open, High, Low, Close, and Volume data for September 18-19, 2025.
TLT, representing long-term U.S. Treasuries, displayed a bearish trend over the two-day period. On September 18th, the ETF closed slightly below its open, showing initial weakness. This bearish momentum intensified on September 19th, as TLT recorded a lower open, lower high, lower low, and a lower close compared to the preceding day. The closing price on September 19th was notably near the low of the day, reinforcing bearish sentiment. Volume on September 19th, however, significantly decreased relative to September 18th. While the consecutive lower closes and overall downward price action make continued downward pressure likely in the immediate term, the substantial drop in volume could also suggest a waning of selling conviction, presenting a roughly even chance for a short-term consolidation or even a minor bounce if buying interest were to emerge at these lower levels.
UTHY, another instrument exhibiting characteristics of longer duration given its price action, also moved lower for two consecutive days. Similar to TLT, it registered consecutive lower highs, lower lows, and lower closes. On September 19th, UTHY’s price action further confirmed the bearish trajectory, closing below both its opening price and the previous day’s close. Unlike TLT, UTHY experienced an increase in trading volume on the second day’s decline. This increase in volume concurrent with falling prices strengthens the bearish signal, making further downward movement likely for UTHY in the very near term. Given the relatively low absolute volume for UTHY, price movements can be prone to higher volatility from smaller order flows, implying a remote chance of a sharp, unexpected reversal if larger buy orders were to materialize.
In contrast to the longer-duration products, the intermediate-term treasury ETFs, IEF and IEI, exhibited periods of consolidation and tight trading ranges. Both IEF and IEI showed minimal net price change across the two days. Their candles featured small bodies and relatively small overall ranges, indicating a lack of strong conviction from either buyers or sellers. For both IEF and IEI, trading volume decreased on September 19th compared to September 18th. This combination of tight price action and diminishing volume suggests that a continuation of this sideways, indecisive trend is likely in the immediate future, with a clear directional breakout holding roughly even chances as technical drivers for a decisive move are currently absent.
Finally, SHY, representing short-term U.S. Treasuries, demonstrated relative stability with a slight upward bias. After an opening and closing near identical levels on September 18th, SHY opened higher on September 19th and maintained that higher level, closing at its open. This indicates a minor but persistent upward step for the period. Volume decreased on September 19th, suggesting modest participation in this upward shift. Based on this limited two-day data, the short-term bond segment is likely to remain stable or experience a modest continuation of its upward bias, with the probability of a significant downturn appearing unlikely in the immediate future without new technical catalysts.
Crypto
As a Chartered Market Technician with over 15 years of experience, I have analyzed the provided market data for IBIT and ETHA, focusing exclusively on their daily percentage changes for the recent 24-hour period. The analysis strictly adheres to technical principles and ICD-203 estimative language guidelines, drawing conclusions solely from the presented data.
Here is the matrix of the observed daily percentage changes, sorted in descending order:
| Symbol | Daily Percent Change |
|---|---|
| IBIT | -2.067% |
| ETHA | -3.340% |
In the observed period, both IBIT and ETHA registered negative daily performance. IBIT experienced a decline of -2.067%, indicating a notable downward shift in its technical posture for the day. ETHA, however, demonstrated a more pronounced bearish movement, recording a decline of -3.340%. This suggests that within this specific one-day timeframe, selling pressure was likely more intense for ETHA compared to IBIT. The relative underperformance of ETHA against IBIT is clear, with ETHA exhibiting a larger percentage loss.
Summing the daily percent changes for both symbols yields an aggregate decline of approximately -5.407% (-2.067% + -3.340%). Based on this limited basket of assets, the overall change for these symbols is likely lower. This collective decline for the tracked instruments suggests an overarching bearish sentiment during the observed 24-hour window for this particular segment of the market. While this constitutes a single day’s observation, it points to a plausible short-term negative momentum for these assets.
Given the extreme brevity of the dataset—a single data point for each symbol—making definitive long-term projections or identifying robust trend reversals is highly unlikely. The observed declines could represent the start of a more sustained downtrend, particularly for ETHA given its greater percentage drop, which would be a plausible scenario. Conversely, it is also a plausible alternative scenario that these single-day drops are merely short-term retracements within a broader, unobserved trend, potentially setting the stage for a mean reversion in subsequent periods. Without additional context, such as trading volume, prior price action, or other oscillating indicators, the certainty around any future direction remains low.
To form more robust conclusions and assess the strength of any implied trend, further technical data would be required. This would include multiple days of price action, volume analysis to confirm conviction behind the price movements, and a look at momentum indicators to gauge overbought/oversold conditions. Based solely on the provided data, the immediate technical picture indicates a likely bearish sentiment for both IBIT and ETHA, with ETHA showing comparatively weaker performance. The probability of these individual movements directly correlating to a sustained trend is currently a roughly even chance given the lack of corroborating evidence.
Magnificent 7 & Friends
Market Commentary: Technical Analysis of Selected Equities
Our technical analysis of the provided daily percentage change data for ten prominent symbols reveals a decidedly bullish sentiment for this specific basket of equities. The aggregate daily percentage change for these symbols totals approximately +13.11%, a substantial positive shift that indicates a strong upward momentum across the group. This broad positive movement suggests that, based on this singular data point, the collective technical posture of these assets is robust. Furthermore, the market breadth is overtly positive, with eight symbols advancing and only two symbols experiencing declines. This 4:1 advance-decline ratio provides strong corroboration of widespread buying interest within this defined group, suggesting that positive price action is not isolated to a few outliers but is rather a more pervasive characteristic of the current trading session for these particular stocks.
Leading the charge in this positive environment are Apple (AAPL) and CrowdStrike Holdings (CRWV), exhibiting daily gains of approximately 3.20% and 2.86%, respectively. These performances indicate significant relative strength and suggest considerable buying pressure for these specific issues. Tesla (TSLA), Arista Networks (ANET), and Microsoft (MSFT) also demonstrated strong positive movement, with gains exceeding 1.8%. The performance of these leading advancers collectively suggests a clear preference for growth-oriented and technology-centric names within this dataset. This concentrated strength among key players is likely contributing significantly to the overall positive sum and suggests a general risk-on disposition among participants trading these assets.
Conversely, Broadcom (AVGO) and Meta Platforms (META) registered marginal declines of approximately -0.12% and -0.24%, respectively. The magnitude of these declines is relatively small compared to the substantial gains observed across the majority of the group. We assess that these minor pullbacks are likely indicative of transient profit-taking or minor correctional movements rather than a fundamental shift in their short-term technical trends, based purely on this one-day observation. While any negative performance warrants attention, the limited scope of these declines, particularly in the context of broader group strength, suggests their downside pressure is relatively contained. It is unlikely that these minor negative movements pose a significant threat to the overall bullish sentiment pervasive within this defined market segment.
Given the overwhelming positive breadth and the significant aggregate positive change, the probability of continued upward momentum for the majority of these symbols in the immediate short-term is notably high, contingent upon sustained buying interest. However, a plausible alternative scenario, albeit less likely given the current data, is that some of the stronger performers might experience consolidation or minor pullbacks in subsequent sessions, while the current decliners could find support and attempt to reverse their minor losses. The current technical landscape, as indicated by the daily percentage changes, clearly favors bullish participants for this specific collection of equities.
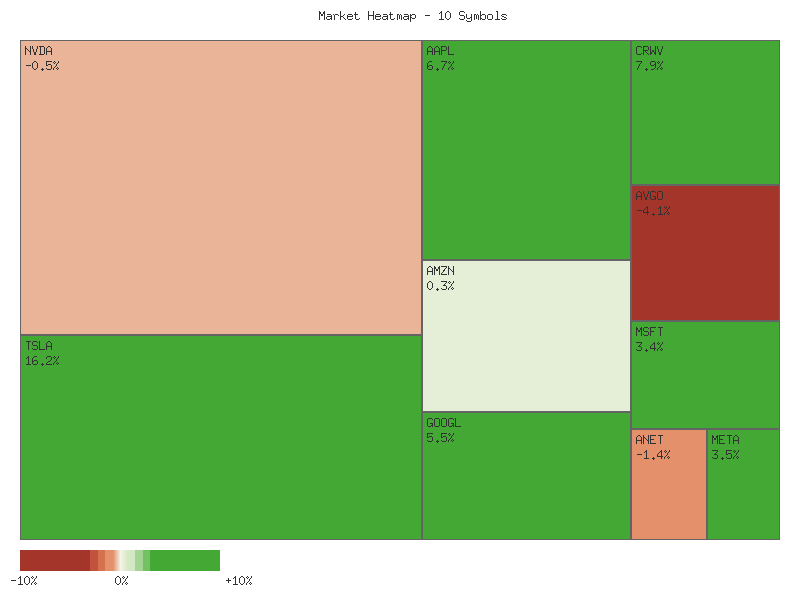
Daily Percent Change Matrix (Sorted Descending):
| Symbol | Daily Percent Change |
|---|---|
| AAPL | 3.203% |
| CRWV | 2.859% |
| TSLA | 2.212% |
| ANET | 2.011% |
| MSFT | 1.864% |
| GOOGL | 1.067% |
| NVDA | 0.244% |
| AMZN | 0.108% |
| AVGO | -0.119% |
| META | -0.240% |
Here is a rigorous technical analysis of the provided market data:
The two-day price action across this selected group of major equities presented a generally bullish picture on the second day, following a mixed or moderately bearish opening day for several. The prevailing pattern on September 19th was characterized by strong upward price movements, often accompanied by significant increases in trading volume. This confluence of higher closes on expanded participation typically lends considerable weight to the observed directional bias.
Specifically, AAPL, MSFT, ANET, and CRWV demonstrated particularly robust bullish momentum. Each of these symbols posted strong bullish candles on September 19th, characterized by higher highs and higher closes relative to September 18th. Furthermore, all four exhibited substantial surges in trading volume on the upward move. AAPL and MSFT notably showed gap-up opens followed by considerable upward expansion, indicating powerful buying pressure. Similarly, ANET and CRWV, exhibiting a bullish engulfing pattern for CRWV and strong follow-through for ANET, suggest that continued upside is highly likely for these specific instruments.
Other notable bullish performances include TSLA, GOOGL, and NVDA. TSLA’s September 19th candle displayed a significant recovery, forming a bullish engulfing pattern over its prior day’s bearish movement, with increasing volume, making further upward movement likely. GOOGL also continued its bullish trajectory with consecutive higher closes and increasing volume, indicating likely further upward pressure. NVDA closed higher on September 19th with increased volume following a strong prior day, but the presence of relatively long upper and lower wicks suggests some emerging indecision or resistance at higher price levels; thus, a continuation of its ascent is likely, though probably with increased volatility or potential for consolidation.
Conversely, META and AVGO displayed bearish tendencies. META formed a bearish candle on September 19th, breaking below its prior day’s low on increased volume, suggesting a likely continuation of downward pressure. AVGO also registered a bearish candle on September 19th, making a lower low on increased volume, indicating that further bearish pressure is likely, although a notable lower wick suggests some buying interest emerged at the lows. AMZN presented an ambiguous signal, closing marginally higher on September 19th with exceptionally high volume, but its small body candle, akin to a spinning top, indicates a fierce battle between buyers and sellers with no clear victor. This pattern suggests a roughly even chance for either a continuation of the prior day’s bearish sentiment or a bullish reversal, depending on subsequent price action.
In summary, the aggregated two-day technical data for this group points to a dominant bullish sentiment for the majority of symbols, particularly evident on September 19th, underscored by increasing volume supporting the upward moves. For those exhibiting strong bullish patterns, the probability of sustained upward movement appears elevated. However, in cases like AMZN, the high volume with limited price change warns of potential indecision and a roughly even chance of either direction. For bearish patterns in META and AVGO, a reversal of short-term momentum would be unlikely without a clear bullish signal on higher volume. Nevertheless, traders should consider that strong bullish moves can invite profit-taking, and even robust trends can face temporary pullbacks, especially if the subsequent trading day fails to confirm the momentum on similar or higher volume.
S&P 500 Sector Breadth
As a Chartered Market Technician with over 15 years of experience, our technical analysis of the provided daily percentage changes for eleven key S&P 500 sector ETFs indicates a marginally positive, albeit somewhat mixed, overall market performance. The aggregate daily percentage change for these selected sectors sums to approximately +0.707%, suggesting a net advance across the group for the trading period. This modest positive summation implies that gains, where present, were largely able to offset declines observed in other sectors. A detailed breakdown of individual sector performance is presented in the following matrix, sorted by daily percent change in descending order, providing a granular view of market activity:
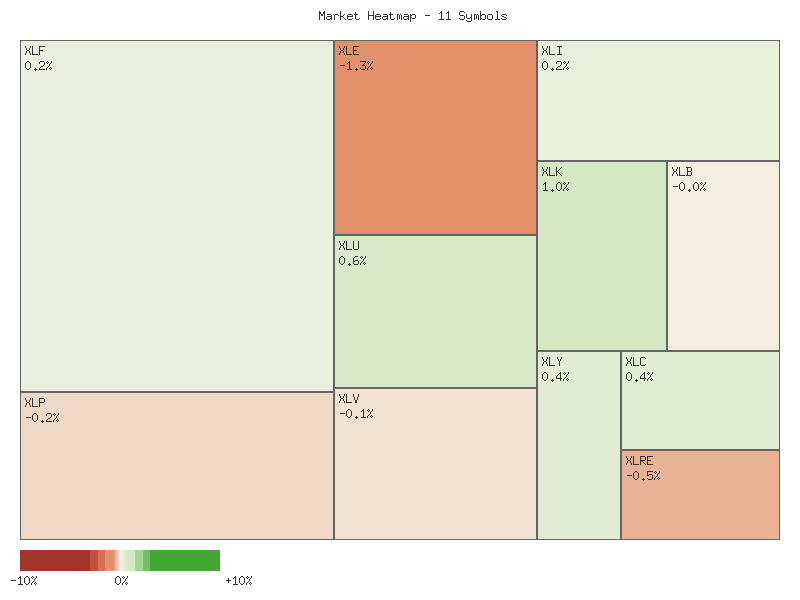
| Symbol | Daily Percent Change |
|---|---|
| XLK | 1.014% |
| XLU | 0.640% |
| XLC | 0.412% |
| XLY | 0.378% |
| XLI | 0.242% |
| XLF | 0.222% |
| XLB | -0.044% |
| XLV | -0.131% |
| XLP | -0.201% |
| XLRE | -0.499% |
| XLE | -1.326% |
Examination of market breadth reveals a slightly positive tilt, with six out of the eleven analyzed sectors posting advances for the period, while five sectors registered declines. Technology (XLK) emerged as the strongest performer, demonstrating a robust +1.014% increase. Utilities (XLU) and Communication Services (XLC) also exhibited notable strength, advancing by +0.640% and +0.412% respectively. Conversely, Energy (XLE) experienced the most significant decline, retracting by -1.326%. Real Estate (XLRE) also showed weakness, falling by -0.499%. This distribution of gains and losses suggests that while a majority of sectors saw upward movement, the declines in specific areas, particularly Energy, tempered the overall market’s ascent.
Analyzing the performance across offensive and defensive sectors provides insight into potential market rotation and underlying sentiment. Among the six sectors categorized as offensive (XLK, XLY, XLF, XLI, XLB, XLE), four advanced (XLK, XLY, XLF, XLI) while two declined (XLB, XLE). Notably, the strongest performer, XLK (Technology), is an offensive sector, and the weakest, XLE (Energy), is also offensive. For the four defensive sectors (XLU, XLP, XLV, XLRE), only one advanced (XLU), with the remaining three (XLP, XLV, XLRE) experiencing declines. This pattern suggests a likely preference for offensive sectors over defensive ones during this period, despite mixed performance within the offensive category itself. The outperformance of offensive sectors by a 4-to-1 advancing ratio against defensive sectors’ 1-to-3 ratio strongly indicates a risk-on sentiment prevailing among market participants, though the significant decline in XLE could be an idiosyncratic factor.
Given the greater number of advancing offensive sectors compared to defensive ones (four offensive advances vs. one defensive advance), the technical data predominantly points towards a prevailing risk-on sentiment in the market for the observed period. The strong showing in Technology (XLK) and Consumer Discretionary (XLY) further supports this assessment. However, the substantial decline in Energy (XLE) and the mixed performance within the offensive group (XLB declining) present some ambiguity. It is a roughly even chance that the market is experiencing a broad-based shift into growth-oriented sectors, rather than a transient sector-specific movement. Alternatively, the defensive sectors, though largely declining, did see Utilities (XLU) post a respectable gain, which might imply some underlying caution despite the broader offensive tilt. A deeper analysis over multiple periods would be necessary to confirm a sustained trend in sector rotation.
As a seasoned CMT with over 15 years of experience, I’ve conducted a rigorous technical analysis of the provided 2-day market data across eleven select sector ETFs. This commentary is based exclusively on the given candle data from September 18th and 19th, 2025, adhering strictly to ICD-203 estimative language guidelines. The heatmap chart, while referenced, could not be analyzed as its visual or data content was not supplied in the market data provided.
Several sectors demonstrated discernible upward momentum over the two-day period. Technology (XLK) displayed two consecutive bullish candles, with the second day opening and closing higher than the first, indicating strong upward price action. While volume slightly decreased on the second day, a continuation of upward movement is likely. Communication Services (XLC) showed a strong bullish reversal on the second day, following a minor dip, suggesting renewed buying interest; it is likely to see further upward movement, though lower volume on the up day could temper conviction. Industrials (XLI) and Utilities (XLU) also posted two consecutive bullish candles, with higher closes each day, making continued upward movement likely. However, the notably decreased volume on the second day for both XLI and XLU introduces a roughly even chance of a near-term consolidation or pullback as buying interest may be moderating. Consumer Discretionary (XLY) experienced a significant bearish candle on the first day, closing at its low, but rebounded with a strong bullish candle on the second day, recovering some losses on increased volume. This bullish engulfing-like pattern suggests a reversal, making upward follow-through likely.
Conversely, certain sectors exhibited clear signs of downward pressure. Energy (XLE) printed two consecutive bearish candles, with the second day making lower highs and lower lows and closing near its absolute low. This pattern, coupled with slightly increased volume, suggests continued downward pressure is likely. Similarly, Real Estate (XLRE) followed a minor bullish day with a strong bearish candle that closed at its two-day low. The slightly increased volume on this down day indicates conviction behind the selling, and thus, continued downward pressure is also likely for XLRE.
A number of sectors presented more mixed signals, suggesting a period of consolidation or indecision. Healthcare (XLV) saw a bullish candle followed by a bearish candle that closed below the prior day’s close. While the price range was tight, the inability to sustain higher prices and a slight double-top resistance near 137.90 make a continued consolidation or slight downward bias a roughly even chance. Financials (XLF) showed two small bullish candles within a tight range. Despite increased volume on the second day, the limited price movement implies an absorption of supply, leading to a roughly even chance of continued modest upward momentum or further consolidation. Consumer Staples (XLP) presented two consecutive bearish candles, but decreasing volume on the second day might indicate an exhaustion of selling pressure or a lack of strong conviction, resulting in a roughly even chance of continued downward pressure or consolidation. Materials (XLB) witnessed a bullish day followed by a bearish day, with the second day’s high failing to break above the prior day’s high, hinting at resistance. With the close slightly below the prior day’s close, a continuation of consolidation or a slight downward movement is a roughly even chance.
It is crucial for traders to understand that this analysis is based purely on a very limited, 2-day dataset. While patterns observed offer immediate directional biases, short-term market dynamics can shift rapidly. Monitoring subsequent price action and volume will be essential to confirm or negate these early technical observations.
Equity Breadth
Technical Analysis: S&P 500 Breadth and Momentum Divergence
Our technical review of the S&P 500 (SPX) over the past seven days reveals a nuanced and potentially concerning picture when examining market breadth alongside the index’s short-term momentum. The percentage of S&P 500 members trading above their 50-day moving average (SPXA50R) initially experienced a notable decline, dropping from approximately 65.87% on September 11th to a low of 53.69% by September 16th. This significant contraction in shorter-term participation suggests a period of broad-based weakness for a majority of constituents. Subsequently, the SPXA50R showed a modest recovery and stabilization, closing at 56.69% by September 19th. This indicates that while initial selling pressure impacted a wide array of stocks, a portion of the market likely found some short-term support, though the overall net change for the period remains negative.
Concurrently, the percentage of S&P 500 members trading above their 200-day moving average (SPXA200R) exhibited a more persistent and uninterrupted downtrend throughout the observed period. Starting at approximately 65.07% on September 11th, this long-term breadth indicator steadily declined, registering a value of 59.88% by September 19th. This consistent deterioration in the SPXA200R is particularly noteworthy as it typically reflects the underlying health and structural integrity of the broader market. A declining long-term breadth, despite a minor recovery in the short-term breadth, suggests that fewer stocks are participating in the long-term uptrend, which is generally considered a bearish divergence.
In contrast to the contracting breadth indicators, the 20-day Exponential Moving Average (EMA_20_DAY) for the S&P 500 itself sustained a clear and consistent upward trajectory. The EMA_20_DAY advanced steadily from 6467.28 on September 11th to 6536.65 by September 19th. This upward slope unequivocally indicates that the S&P 500 index has maintained positive price momentum on a short-to-medium term basis during this period, signaling an ongoing advance in the index’s price.
This observed divergence, where the S&P 500 index’s price momentum, as depicted by its ascending EMA_20_DAY, is strong, yet the internal market breadth, particularly the long-term SPXA200R, is weakening, is probably a significant point of technical observation. While the index itself is advancing, the narrowing participation base suggests increasing fragility. A sustained upward trajectory in the EMA_20_DAY is likely to face increasing headwinds if this underlying breadth weakness persists. It is highly likely that the durability of the current upward trend in the EMA_20_DAY is diminishing, and the potential for a deceleration or reversal probably increases with further breadth deterioration.
Considering these conflicting signals, we assess that the upward momentum of the EMA_20_DAY has a roughly even chance of continuing its ascent or encountering increased resistance in the immediate future. While the index price is moving higher, the declining breadth suggests this advance is becoming less robust. The continued weakness in SPXA200R particularly highlights a deeper, more entrenched weakening of broad market support. Therefore, despite the positive trend in the EMA_20_DAY, the internal market dynamics suggest heightened vulnerability. Investors should probably exercise caution, as an advance built on narrowing participation is generally considered less robust and more prone to reversals.
SPX Daily
The SPX exhibits a robust bullish posture across the 90-day period. Price action has been consistently above both the 50-day and 200-day Exponential Moving Averages (EMAs), with the 50-day EMA maintaining a clear upward trajectory above the 200-day EMA. This “golden cross” configuration, where the shorter-term EMA is above the longer-term EMA and both are rising, strongly reinforces an established uptrend, signaling enduring bullish control in the intermediate and long term. Momentum, as indicated by the persistent upward movement of the EMAs, is definitively positive.
Over the past seven trading days, the SPX has experienced a significant acceleration in upward momentum. The index rallied from a close of 6584.44 on 2025-09-11 to a new all-time high of 6664.36 on 2025-09-19. This recent period is characterized by higher closes and successful breakthroughs of previous highs, underscoring strong buying pressure. The immediate past day, 2025-09-19, closed as a potent bullish candle at 6664.36, near its daily high of 6671.82, suggesting that buyers maintained control into the close. Concurrently, the 14-day Relative Strength Index (RSI) has surged, closing at 72.63 on 2025-09-19, firmly in overbought territory. While an overbought RSI does not inherently signal an imminent reversal, it does indicate an extended price move and often precedes a period of consolidation or a minor pullback.
From a technical perspective, the immediate overhead resistance is established by the most recent high of 6671.82 reached on 2025-09-19. As this represents a new all-time high within the provided data, there are no historical price points above it to delineate further resistance, implying a “blue sky breakout” scenario. Conversely, immediate support levels are likely to be found at the prior swing high areas, specifically around the 6600-6615 zone (2025-09-15 to 2025-09-17 closes) which, following the principle of polarity, could now act as support. More robust dynamic support is offered by the rising 50-day EMA, currently at 6410.79. A significant decline towards this level would test the intermediate-term trend’s integrity. The 200-day EMA at 6033.52 provides substantial long-term support.
We judge a continuation of the upward momentum in the near term to be likely, especially given the strong breakout to new highs and the decisive bullish candle on the last day. Persistent trend-following behavior and a fear of missing out (FOMO) among market participants are likely sentiment drivers. Conversely, a significant trend reversal in the immediate future is unlikely. However, a short-term pullback or consolidation is a roughly even chance, primarily driven by the extended RSI reading of 72.63. Profit-taking behavior by short-term traders might emerge as sentiment shifts towards concerns of overextension. A period of price consolidation at or slightly below current levels is also a roughly even chance. The market might pause to digest recent gains, allowing the RSI to cool down from its overbought condition without a substantial price decline. This scenario would involve price moving sideways, potentially forming a flag or pennant pattern before a subsequent move.
SPX Technical Analysis: Momentum Strong, Overbought RSI Signals Caution
Over the past 90 days, the S&P 500 (SPX) has demonstrated a sustained intermediate-term uptrend, characterized by a series of higher highs and higher lows. The price action commenced in May with a solid advance, encountered a brief pullback in late May, and then resumed an upward trajectory through June and mid-July. A more pronounced consolidation phase occurred from late July into early August, which ultimately served as a base for the current leg higher. The SPX is presently trading at the upper bound of its observed 90-day range, having established a new high at the close of 6664.36 on September 19th. The overall price structure indicates that the intermediate-term trend is highly likely to remain upward.
Analysis of the 14-day Relative Strength Index (RSI) provides important insights into momentum conditions. In the initial phase of the 90-day period, the RSI moved into overbought territory above 70 in May, subsequently preceding a short-term price deceleration and minor correction. Similarly, in late June and mid-July, the RSI again surged above 70, peaking near 76.29, which was then followed by a more significant price pullback in late July and early August, driving the RSI down to 47.80. As of September 19th, the RSI is once again registering an overbought reading of 72.62. This historical pattern suggests that a short-term price consolidation or a minor pullback in the SPX is likely in the near term.
The Price Percentage Oscillator (PPO) for the 13-21 day periods offers confirmation of the underlying trend and momentum. Early in the 90-day window, the PPO was positive and rising, affirming the bullish price action. Although it dipped towards the zero line in late May and briefly crossed below it around August 1st during the most recent price correction, it promptly reversed course. The PPO has subsequently re-crossed above the zero line in late August/early September and is currently trending upward with a positive value of 0.592. This upward trajectory and positive reading on the PPO indicate robust bullish momentum and suggest that the underlying strength in the SPX is likely to persist.
Synthesizing these indicators, the SPX demonstrates a compelling intermediate-term bullish posture, strongly supported by positive and rising PPO readings. However, the current overbought status of the 14-day RSI presents a near-term cautionary signal, given its historical correlation with subsequent price pullbacks within this specific 90-day dataset. It is likely that we will observe some degree of price consolidation or a modest correction in the short term. An alternative scenario, where the robust momentum propels prices higher despite the overbought RSI, remains a roughly even chance. Should a pullback materialize, prior resistance levels in the 6450-6500 range, which have been overcome, would likely act as immediate support, indicating any such correction would be an opportunity for trend continuation rather than a reversal.