Daily Market Technical Analysis
Daily Market Technical Analysis
Market Overview
Equity markets display short-term bullish momentum, particularly in small-caps and technology sectors, with the S&P 500 maintaining a robust upward trend. However, overbought RSI conditions are prevalent across SPX, QQQ, and IWM, while QQQ also exhibits a significant bearish PPO divergence, making a near-term correction or consolidation highly likely. Although several equity advances were on decreasing volume, mid-caps are likely to sustain upward momentum. Conversely, commodities show a likely bearish bias, with natural gas (UNG) highly likely to see further declines, and gold (GLD) likely to consolidate. Bonds are broadly bearish, with long-duration Treasuries (TLT) highly likely to experience further downside. Crypto assets (IBIT, ETHA) demonstrate a highly likely positive short-term sentiment. The S&P 500’s advancing price amidst contracting market breadth presents a roughly even chance of continued ascent under narrow participation or a slowdown.
Market Indices
As a Chartered Market Technician with over 15 years of experience, I have analyzed the provided market data for September 18, 2025, applying rigorous technical analysis principles. My assessment focuses exclusively on the presented technical indicators without external context.
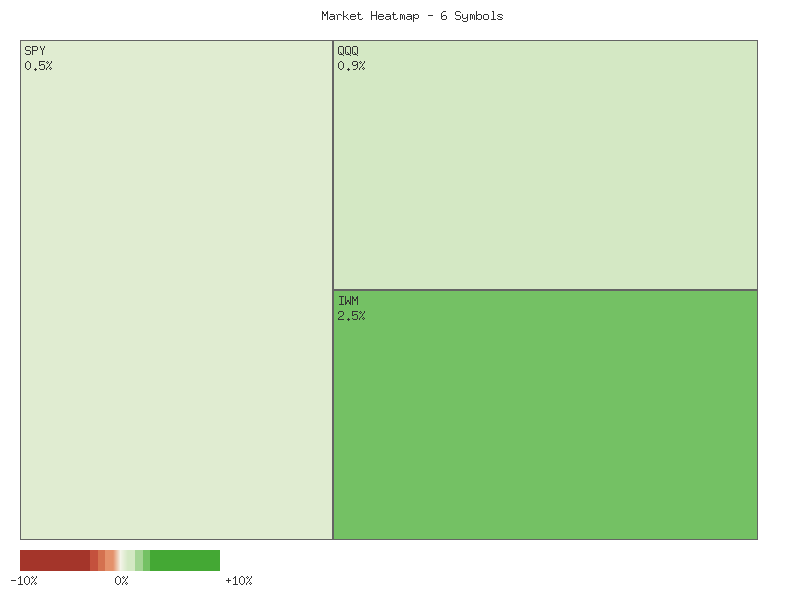
The daily percentage changes for the selected equity-focused instruments on September 18, 2025, illustrate a distinctly positive market session. The following matrix summarizes their performance, sorted in descending order:
| Symbol | Daily Percent Change |
|---|---|
| IWM | 2.491% |
| IJR | 2.272% |
| MDY | 1.225% |
| QQQ | 0.902% |
| SPX | 0.479% |
| OEF | 0.389% |
The aggregated sum of these daily percentage changes is approximately +7.758%, indicating a robust overall upward movement for this basket of market segments. This broad collective advance suggests a significant buying interest across various market capitalizations, with small-cap indices (IWM, IJR) demonstrating particularly strong performance.
Market breadth, as derived from the provided data, was unequivocally strong for the session. All six analyzed symbols—IWM, IJR, MDY, QQQ, SPX, and OEF—registered positive daily percentage changes, resulting in six advancing symbols and zero declining symbols. Such widespread participation across large-cap, mid-cap, and small-cap segments points to a high degree of positive market conviction. This broad-based rally makes it highly likely that the underlying market experienced substantial buying pressure throughout the session, suggesting a strong and generalized upward momentum.
Concurrent with the equity performance, the VIX, a key measure of implied market volatility, registered a slight decline of -0.127% on September 18, 2025. Reviewing the 7-day candle data for VIX reveals a dynamic volatility landscape. The VIX initially trended lower from September 10-12, reaching a close of 14.76. This was followed by a sharp two-day surge on September 15-16, pushing prices from 14.76 to a 7-day closing high of 16.36. This upward move in the VIX suggested an increase in market uncertainty during that specific period. However, September 17 marked a turning point with a notable bearish candle (open 16.42, close 15.72), which closed significantly off its intra-day high of 16.75 and below the prior day’s open, indicating a probable cooling of upward volatility pressure.
On September 18, the VIX opened lower at 14.93 but demonstrated an intra-day recovery, closing at 15.70. This closing price is almost identical to the previous day’s close (15.72), despite the nominal daily percentage decrease. The VIX closed above its open for the day, suggesting some stabilization after the previous session’s drop from the 7-day high. The concurrent strong positive performance of the equity indices, combined with the modest VIX decline, aligns with the typical inverse relationship between equities and volatility. Given the broad equity advance and the VIX’s inability to sustain levels above the September 17 peak of 16.75, it is likely that market participants perceive reduced near-term uncertainty. However, the VIX closing at 15.70, which is still above its range earlier in the 7-day period (e.g., 14.76), suggests the overall level of implied volatility remains somewhat elevated. A further decline in VIX below the 15.00 level would highly likely reinforce a bullish outlook for equities, whereas a break and sustained move above 16.00 could indicate renewed caution and potential downside risk for the broader market. A continued modest decline in VIX, accompanied by sustained equity strength, appears probable in the very near term.
Technical Market Commentary: Two-Day ETF Performance Analysis (September 17-18, 2025)
A review of the provided two-day market data for key ETFs (SPY, QQQ, IWM, IJR, MDY, OEF) indicates a prevailing short-term bullish sentiment, particularly evidenced in the second trading session. On September 17th, most indices exhibited initial strength, often opening higher, but faced some intraday selling pressure, resulting in closes that were either slightly below or near their opening prices. Price ranges were generally wide across the board. However, September 18th saw a notable shift, with all observed indices opening higher than the previous day’s close and sustaining buying pressure throughout the session to close near their daily highs, establishing higher highs and higher lows compared to the prior day. This price action pattern across a diverse set of market capitalization segments suggests a broad-based, albeit short-term, upward momentum.
Focusing on the large-cap segments, SPY (S&P 500 ETF), QQQ (Nasdaq 100 ETF), and OEF (S&P 100 ETF) demonstrated consistent bullish price action over the two-day period. After Day 1’s mixed close, all three recorded strong bullish candles on Day 2, with closes significantly above their respective Day 1 closes and near their intraday highs. Critically, this upward price movement on September 18th was accompanied by a decrease in trading volume for SPY, QQQ, and OEF compared to the prior day. While the higher highs, higher lows, and higher closes strongly suggest an immediate bullish continuation, the declining volume could be a point of consideration. It presents a roughly even chance that this reduced volume indicates either a temporary consolidation or a potential, albeit slight, weakening of conviction behind the rally, rather than a robust, widely supported advance.
The small and mid-cap indices also mirrored the general bullish shift. IWM (Russell 2000 ETF) and IJR (S&P SmallCap 600 ETF) both posted strong bullish candles on September 18th, closing at or near their daily highs and well above their September 17th closes. Similar to the large-caps, these advances occurred on significantly lower trading volumes. IWM’s volume on Day 2 was approximately 38% lower than Day 1, while IJR’s was down by about 33%. This volume trend for small-caps reinforces the observation from large-caps, suggesting a short-term rally with possibly diminishing participation, which could lead to a less durable upside push beyond the immediate term.
In contrast, MDY (S&P MidCap 400 ETF) stood out in its volume profile. While also exhibiting a strong bullish candle on September 18th, closing near its high and well above its Day 1 close, MDY’s upward move was accompanied by a slight increase in trading volume. This divergence makes it very likely that the bullish conviction behind the mid-cap rally is somewhat stronger compared to the large-cap and small-cap segments, as rising price with rising volume is often seen as a more reliable indicator of strength.
Considering the entirety of the provided two-day data, it is very likely that the immediate short-term trend for the broad market, as represented by these ETFs, is upward. All indices formed bullish candles on September 18th, closing above their prior day’s closes and establishing higher highs and higher lows. However, the predominantly decreasing volume across SPY, QQQ, IWM, IJR, and OEF during this advance suggests a roughly even chance that the current bullish momentum might be prone to consolidation or a shallower subsequent rally. Conversely, MDY’s increased volume on its bullish day makes a sustained short-term upward move for mid-caps very likely. A significant bearish reversal solely based on these two days of data appears unlikely given the strong closes across all ETFs on September 18th.
Good morning traders, here is your technical analysis update for the S&P 500 (SPX) based on the provided 90-day market data.
The SPX has exhibited a persistent upward trajectory over the past 90 days, establishing a robust bullish trend characterized by a clear series of higher highs and higher lows. Since mid-May, the index has advanced significantly from the 5800-level to surpass 6600 as of the most recent data point. The latest price action, spanning from early September through September 18th, indicates a strong continuation of this rally, with the SPX recording consecutive gains and reaching new all-time highs. This sustained upward momentum is the dominant feature of the provided price data, confirming a well-established bullish phase.
Our analysis of the 14-day Relative Strength Index (RSI) reveals that the SPX is currently in overbought territory, registering a value of 70.04 as of September 18th. Historical data within this 90-day window suggests a consistent pattern where such overbought conditions typically precede either a period of consolidation or a discernible price pullback. For instance, previous ascents of the RSI into the 70s in late June and late July were followed by corrective price action. The most notable pullback in early August, where the index experienced a significant decline, was immediately preceded by the RSI sustaining levels above 74. Therefore, given the current extended RSI reading, we judge that a price consolidation or minor pullback is likely in the near term.
The Percentage Price Oscillator (PPO) for the 13-day and 21-day EMAs is currently positive at 0.5577 and has been steadily increasing since early September. This rising PPO directly corroborates the robust upward momentum observed in price action. A positive and rising PPO signifies that shorter-term momentum is stronger than longer-term momentum, lending support to the ongoing bullish trend. However, it is noteworthy that while the PPO is positive and rising, its current value has not yet reached the higher peaks observed in May (1.37) or early July (0.93). This suggests that while current momentum is strong, it may not be as aggressively parabolic as some previous legs of the rally. Critically, there is no discernible bearish divergence between price and PPO at this juncture, which mitigates the immediate concern of a major reversal solely based on this momentum indicator.
Synthesizing the indicators, the overall trend for the SPX is unequivocally bullish, with the persistent higher highs and rising PPO affirming the rally’s strength. However, the sustained overbought condition indicated by the 14-day RSI (70.04) suggests that the index is likely to experience some form of retrenchment or sideways movement in the coming sessions to alleviate this upward pressure. A direct continuation of the sharp upward trend without a significant pullback is a plausible alternative scenario, particularly if momentum intensifies further and the PPO continues its ascent to previous extreme levels. Nevertheless, considering historical patterns of RSI above 70 within this dataset, we judge that an immediate, sustained continuation of the current sharp upward move is unlikely. Any significant reversal (e.g., breaking below recent established support levels) would require further technical confirmation, which is not currently present based solely on the PPO.
Here is a technical analysis of QQQ based solely on the provided 90-day candle, 14-day RSI, and 13-21-day PPO data.
QQQ has experienced a strong, sustained uptrend over the past 90 days, marked by a consistent series of higher highs and higher lows. The price action demonstrates clear bullish momentum, culminating in QQQ reaching fresh historical highs at the conclusion of the provided data series on September 18th. This persistent upward trajectory has been interrupted by relatively brief, shallow pullbacks, which have consistently found buying support, indicating a robust bullish structure throughout the observed period. Volume data shows variability but no significant anomalies that would strongly contradict the price trend, suggesting the advances have generally been supported.
The 14-day Relative Strength Index (RSI) largely corroborates the bullish trend, frequently entering overbought territory (above 70) during periods of strong price advancement, as observed in May, late June, and particularly through much of July. Historically within this data, extended periods above 70, or rapid ascents into this zone, are often followed by price pullbacks or periods of consolidation, as seen in late May, mid-June, and early August where the RSI significantly retreated. The latest RSI reading of 71.05 places QQQ squarely in an overbought condition. Based on the historical behavior within this 90-day sample, a near-term price consolidation or pullback is likely.
The Percentage Price Oscillator (PPO) reveals a more nuanced and potentially concerning picture. While the PPO maintained positive values for most of the 90-day period, indicating bullish momentum, a significant bearish divergence has emerged. From its peak PPO value in May (approximately 1.91) through to the latest reading in September (approximately 0.66), QQQ’s price has recorded consistently higher highs. However, during the same interval, the PPO has failed to register corresponding higher highs, instead showing a general downward drift in its peaks despite price advances. This pattern, where price makes new highs while the momentum indicator makes lower highs, strongly suggests waning underlying bullish momentum and makes a future price reversal or significant correction highly likely. While the PPO has shown an upward trajectory from its early September low of 0.17, it remains well below previous momentum peaks.
Combining these technical signals, the confluence of an overbought RSI (71.05) and a pronounced bearish divergence on the PPO presents a high probability of a near-term market correction or consolidation for QQQ. While the strong recent price action and the upward tick in PPO from early September indicate some continuing bullish vigor, the underlying momentum, as evidenced by the PPO’s divergence, is assessed to be weakening over the medium term. An alternative scenario, though less likely, is that the recent rebound in PPO from its September low could sustain the current price advance, particularly if it accelerates meaningfully. However, a period of sideways trading or a modest pullback in price is likely to relieve the overbought condition and address the momentum concerns raised by the PPO divergence.
Here is a technical analysis of IWM based on the provided 90-day market data:
IWM has exhibited a discernible upward trend over the past 90 days, marked by a series of higher highs and higher lows, despite experiencing intermittent pullbacks and periods of consolidation. The price action since mid-August, in particular, indicates a renewed and accelerating bullish momentum. Following a significant price surge on August 22, the ETF underwent a brief consolidation phase before resuming its upward trajectory in September. The final data point on September 18 shows a robust bullish candle, closing significantly higher on the day with notably elevated volume. This strong close near the session high, supported by increased trading participation, is likely indicative of sustained upward pressure in the immediate term. However, the rapid nature of this recent advance may introduce some short-term volatility.
The 14-day Relative Strength Index (RSI) for IWM has largely mirrored the underlying price movements, demonstrating several cycles of moving into and out of overbought conditions. On September 18, the RSI registered a value of 71.23, placing IWM firmly in overbought territory (above 70). Historically, such levels have often preceded a consolidation phase or a minor price correction, as observed when the RSI peaked at 71.57 on July 3, which was followed by a subsequent price retracement. Therefore, it is likely that IWM may experience a near-term pause or a modest retracement from its current elevated levels. However, in strong and established uptrends, an overbought RSI can persist for an extended period, suggesting that this condition alone does not guarantee an imminent reversal, but rather an increased probability of reduced upside momentum or a minor consolidation.
Complementing the RSI, the 13,21-day Percentage Price Oscillator (PPO) provides further insight into momentum. Throughout the 90-day period, the PPO for IWM has consistently remained in positive territory, indicating that the shorter-term moving average has generally stayed above the longer-term moving average. This sustained positive PPO signifies an overarching bullish bias in momentum. While the PPO experienced several periods of declining values, notably reaching a low of 0.084 on August 11, it consistently reversed course before turning negative, suggesting persistent underlying demand or a lack of strong selling momentum. The current PPO reading of 0.95 on September 18 represents robust positive momentum. This value, while substantial, has not reached the highest PPO readings observed earlier in the period (e.g., 1.31 on May 20 or 1.17 on July 10), suggesting there may be additional room for momentum expansion. This sustained positive PPO profile makes a continuation of the bullish trend likely, supported by strong buying interest.
Considering the confluence of these technical indicators, the immediate outlook for IWM is likely bullish. The strong price action on September 18, characterized by a significant close on high volume, combined with a positive and ascending PPO, strongly supports the continuation of the current uptrend. However, the RSI’s current overbought reading presents a roughly even chance of a near-term consolidation or a minor retracement before further advances. An alternative, albeit less likely, scenario is a more significant pullback if buying pressure suddenly wanes following the recent steep climb. Should IWM sustain its price above recent consolidation zones, it is highly likely to attempt higher price points, although a temporary cooling period is probable due to the extended overbought RSI. The overall technical posture remains constructive for further gains, albeit with an increased probability of short-term volatility.
Tech Sector Analysis
CMT Technical Analysis: QQQ/SPY Relative Performance
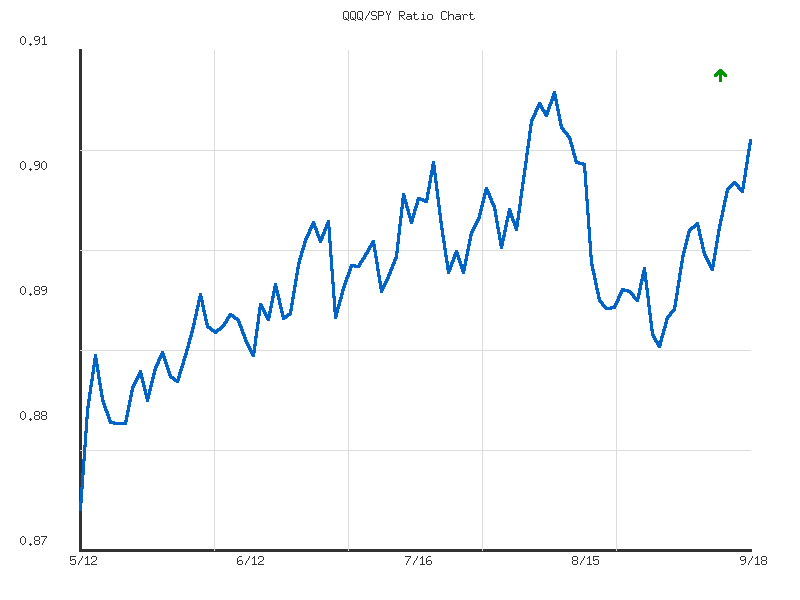
Our analysis of the provided QQQ/SPY ratio data reveals a nuanced picture of relative performance between the technology-heavy NASDAQ-100 and the broader S&P 500. Over the immediate 14-day period, the ratio demonstrates a discernible upward trend, moving from a low of 0.8834 on September 2nd to its current high of 0.8989. This 1.66% increase signifies that QQQ has been outperforming SPY over the past two weeks. However, the trend is characterized as “weak” in strength, suggesting that while QQQ is gaining ground, the momentum behind this outperformance is not robust and may be susceptible to reversals without strong follow-through. The current ratio stands at the highest point within this 14-day window, indicating recent strength.
Expanding our perspective to the 30-day timeframe presents a slightly different overall sentiment. The QQQ/SPY ratio’s trend direction for this period is explicitly labeled as “sideways,” with a marginal net decrease of 0.16% from the start to the end of the period. This indicates that over the past month, QQQ’s performance relative to SPY has, on balance, been relatively flat, despite the more recent short-term uplift. The “weak” strength assigned to this sideways trend reinforces the notion that there has been no dominant directional conviction in relative performance over the medium term. The current ratio of 0.8989 is notably higher than the 30-day average of 0.8924, sitting at the 81st percentile of the 30-day range, but it has not surpassed the peak observed on August 12th (0.9025).
Considering these converging and diverging signals, it is likely that the recent short-term outperformance of QQQ relative to SPY could persist in the very near term. The current ratio being at the 14-day high, combined with an established (albeit weak) upward trend, suggests that QQQ will probably maintain its higher ground relative to SPY in the immediate future. However, the weak strength of both the 14-day upward trend and the 30-day sideways trend cautions against strong directional bets. Therefore, it is roughly an even chance that this weak upward trajectory will encounter resistance, especially given the established ceiling around the 0.9025 level within the broader 30-day context. A retest of the August high is certainly possible if the short-term strength gains more conviction.
Alternatively, should the underlying “weak” strength of the short-term trend give way, a reversion to the mean within the 30-day sideways channel is also a plausible scenario. It is unlikely that QQQ would immediately revert to significant underperformance relative to SPY given its current position at the 14-day high and elevated relative position within the 30-day range. However, if the ratio fails to break above the established 30-day high around 0.9025, it would be highly probable to see a consolidation or a slight pullback towards the 30-day average of 0.8924. Traders should monitor for a decisive break above 0.9025 as a confirmation of renewed QQQ leadership, or a rejection from this level as an indication that the broader sideways consolidation will continue.
CMT Technical Analysis: QQQ/SPY Relative Performance (90-Day)
Examining the 90-day relative performance ratio of QQQ to SPY reveals a distinct and persistent upward trend. The data indicates that QQQ has moderately outperformed SPY over this period, evidenced by a 3.19% increase in the ratio. The underlying trend direction is clearly identified as ‘up’ with a ‘moderate’ strength, suggesting a sustained and healthy preference for technology-focused equities compared to the broader market. The consistently low volatility of 0.0000378 over these 90 days further supports the notion of a relatively stable, rather than erratic, upward movement, indicating that this outperformance has been relatively smooth and not characterized by sharp, unpredictable swings.
The ratio’s journey over the past 90 days has established identifiable technical boundaries. The lowest recorded ratio was 0.8711, serving as a critical support level, while the peak performance was registered at 0.9025, now acting as overhead resistance. The current ratio, at 0.8989, positions itself remarkably close to this 90-day high. Analyzing the most recent price action, the ratio has shown a series of higher lows and higher highs, particularly in the last several data points leading up to September 18th. Following minor pullbacks around early-mid September, the ratio has demonstrated renewed buying pressure, closing strongly at 0.8989, reinforcing the upward momentum and proximity to the resistance.
Considering the established moderate upward trend, the low volatility, and the current ratio’s position near its 90-day high with recent strong closes, a continuation of QQQ’s outperformance relative to SPY is highly likely. The immediate technical outlook suggests that the ratio has built sufficient momentum to test the 0.9025 resistance level. A definitive breakout above this level is likely to signal further strength and potentially lead to a new short-term relative high for QQQ. Investors should monitor this resistance level closely as its breach would confirm the continuation of the current bullish relative trend.
While the primary scenario points to continued outperformance, alternative outcomes warrant consideration. There is a roughly even chance that the 0.9025 level could act as stiff resistance, triggering a temporary pullback or period of consolidation. Should the ratio fail to decisively break above this resistance, a retracement towards the 90-day average ratio of 0.8889 is possible. However, given the sustained ‘up’ trend and moderate strength, a significant reversal below the established support at 0.8711 in the immediate term is highly unlikely based on the provided technical data. Any substantial downside would more likely manifest as a period of consolidation within the established range, rather than a reversal of the overall trend.
IWM vs. SPY
As a Chartered Market Technician with over 15 years of experience, I’ve analyzed the provided IWM/SPY ratio data to assess the relative performance between the Russell 2000 (IWM) and the S&P 500 (SPY). This ratio serves as a valuable technical indicator for discerning whether small-cap stocks are outperforming or underperforming large-cap, technology-heavy constituents.
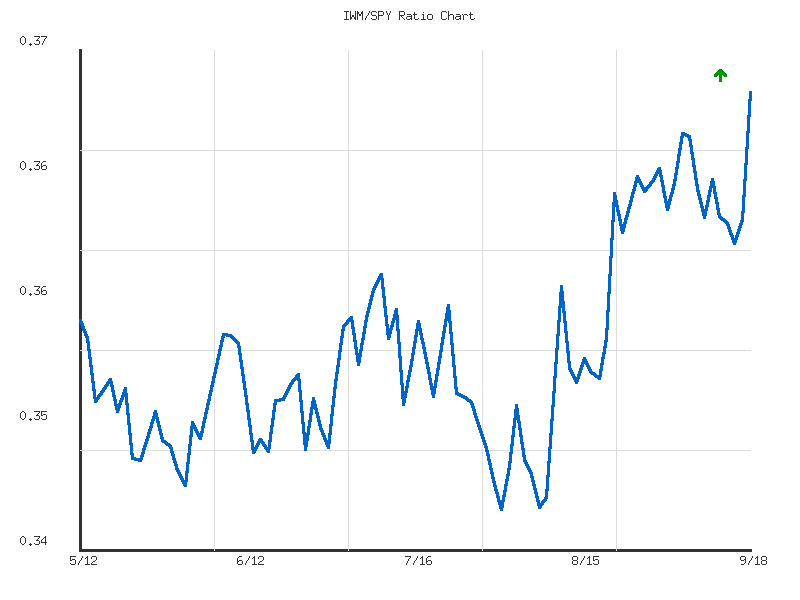
Over the 30-day period, the RATIO:IWM/SPY displays a clear upward trend, characterized as “moderate” in strength. This indicates that the Russell 2000 has been outperforming the S&P 500 over the past month. The ratio has experienced a significant change of 6.325% during this timeframe, with the current ratio of 0.3697 representing the high point for the entire 30-day period. This suggests sustained positive relative momentum for small-caps as the period concluded.
Zooming into the more recent 14-day window, the RATIO:IWM/SPY also exhibits an “up” trend. However, the trend strength for this shorter period is classified as “weak,” despite a 1.406% increase. Notably, the current ratio of 0.3697 is the high point for this 14-day period as well, aligning with the 30-day high. While IWM continued to outperform SPY during these recent two weeks, the “weak” strength suggests that this immediate relative upward movement lacked robust conviction compared to the broader monthly trend.
Synthesizing these observations, the overarching technical picture points to IWM’s outperformance against SPY. Given the “moderate” strength of the 30-day upward trend and the current ratio closing at the high for both examined periods, it is likely that the Russell 2000 will continue to exhibit relative strength against the S&P 500 in the near term. The momentum, while currently weak on a very short-term basis, has been building with moderate conviction over the past month.
However, the “weak” trend strength over the last 14 days introduces a nuanced perspective for tactical considerations. While continued outperformance is likely, a significant acceleration in the pace of this relative outperformance from current levels is unlikely without new technical impetus. It is a roughly even chance that the IWM/SPY ratio could experience a period of consolidation or a more gradual ascent, as the market digests the recent peak in relative strength with less underlying conviction for immediate strong acceleration. A complete reversal, leading to IWM underperformance, is highly unlikely in the immediate future, given the consistent “up” trend across both observed timeframes and the current ratio holding at a high relative position.
Technical Analysis: IWM/SPY Relative Strength (90-Day)
The provided 90-day data for the IWM/SPY ratio reveals a moderate upward trend, indicating that the iShares Russell 2000 ETF (IWM), representing small-cap stocks, has demonstrated a sustained period of relative outperformance against the SPDR S&P 500 ETF Trust (SPY) over the analyzed interval from May 12 to September 18, 2025. The ratio advanced approximately 3.69% over the period, signaling an increasing appetite for risk among market participants as capital rotation appears to have favored smaller capitalization equities. Critically, the ratio concluded the 90-day period at its absolute high of 0.3697. This peak, confirmed by a “relative_position” of 1, suggests strong closing momentum and a decisive technical breakout above all prior resistance levels within the observation window. The overall pattern suggests a shift in market leadership favoring smaller capitalization stocks.
During the 90-day observation, the IWM/SPY ratio established a significant technical floor around the 0.3456 level on August 1st. This low point subsequently served as a launching pad for a distinct rally, propelling the ratio upward. Following this reversal, the ratio experienced a period of upward drift and minor consolidations in mid-August before initiating a more accelerated ascent in late August and early September. Previous relative strength peaks observed in July (e.g., around 0.3592 on July 10th) and earlier in May (e.g., 0.3565 on May 12th) were progressively surpassed, culminating in the current record high for the period. The consistent establishment of higher lows and higher highs in the ratio reinforces the underlying strength of this relative trend.
The prevailing technical posture suggests that a continuation of IWM’s relative outperformance against SPY is probable in the immediate term. The consistent pattern of higher lows and higher highs, culminating in a fresh 90-day high at the close, signals robust relative momentum. It is likely that this trend will persist, albeit potentially at a moderate pace, as indicated by the “moderate” strength attribute. However, alternative scenarios warrant consideration. A period of consolidation or a slight retracement of the ratio is a roughly even chance, as assets often pause or consolidate after achieving significant relative strength bursts. Such a retracement would likely seek support at previously established higher lows or potentially retest the recently breached 0.3697 level, which would then act as new support. A sharp reversal of the relative trend, leading to IWM significantly underperforming SPY, appears unlikely in the short term, given the clear upward momentum captured by the summary data and the concluding endpoint at the period’s high.
In summary, the technical data for the IWM/SPY ratio over the past 90 days depicts a market environment where small-cap stocks have demonstrated clear and sustained relative strength compared to large-cap equities. The ratio’s ability to close at its 90-day high of 0.3697, following a consistent moderate upward trend, underscores a powerful technical picture. This strong technical positioning suggests a continued preference for risk-on assets within this segment of the market. Based solely on this data, it is highly likely that IWM will maintain its relative outperformance against SPY in the near future.
Commodities
Here is a technical analysis of the provided market data, adhering strictly to CMT principles and ICD-203 estimative language guidelines:
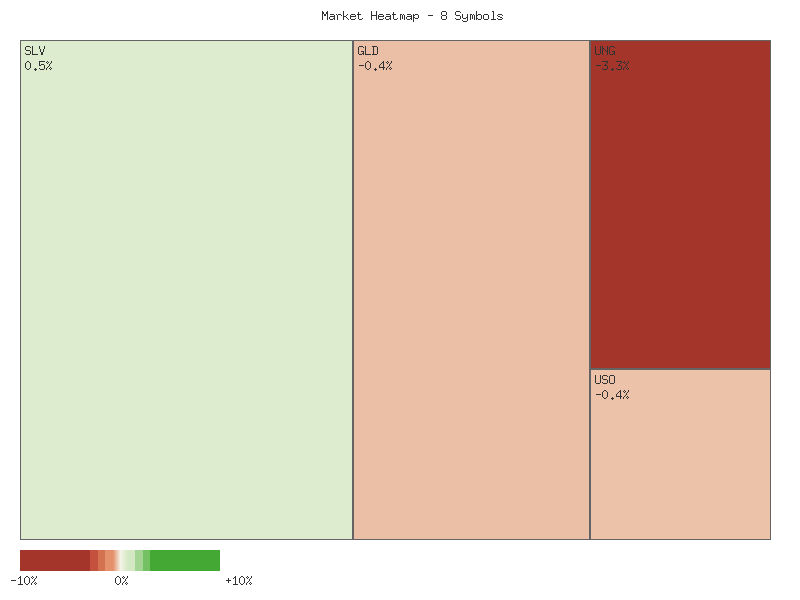
The daily performance across the specified commodity symbols exhibits a predominantly bearish bias for the observed session. The sorted daily percent change matrix, from the highest gain to the greatest loss, is presented below:
| Symbol | Daily Percent Change |
|---|---|
| SLV | 0.5292% |
| CPER | -0.2815% |
| UGA | -0.2818% |
| USO | -0.3735% |
| GLD | -0.4006% |
| DBC | -0.4437% |
| CORN | -0.7830% |
| UNG | -3.2824% |
The aggregated daily performance across these eight commodities indicates a generally lower sentiment, totaling a sum of -5.3173% for the session. This broad negative summation suggests a likely bearish bias for the overall commodity complex on this particular trading day, with a notable significant decline in natural gas (UNG) contributing heavily to the downside.
Market breadth for the analyzed symbols is decisively negative. Out of eight observed commodities, seven experienced declines while only one, SLV (silver), registered an advance. This overwhelming ratio of declining to advancing symbols strongly suggests underlying selling pressure across the majority of these commodity sectors. Such a breadth configuration typically reinforces bearish sentiment and indicates that the majority of capital flows were directed out of these assets during the session, with only precious metals potentially offering a marginal defensive play or experiencing short-term speculative interest in silver.
Turning to the GLD/SLV ratio over the 14-day period, the data indicates a “sideways” trend with “weak” strength and a modest positive change of 0.5181%. The current ratio stands at 8.8344, which is positioned in the lower third of its 14-day range (relative position of 0.3758). This technical posture suggests a roughly even chance for the ratio to continue consolidating within its recent range in the very near term. This implies that neither gold nor silver is exhibiting a clear, strong dominance over the other over this shorter horizon, and continued price discovery is likely within the established trading band.
Expanding the view to the 30-day GLD/SLV ratio reveals a “down” trend, also characterized by “weak” strength, and a more significant negative change of -1.9274%. The current ratio of 8.8344 is positioned at the lower end of its 30-day range (relative position of 0.3198), consistent with the shorter-term observation. The divergence between the 14-day sideways consolidation and the 30-day downtrend indicates that while the immediate outperformance of silver (represented by a declining ratio) may have paused in the very short term, the longer-term bias for silver to outperform gold remains a distinct possibility. Therefore, it is likely that silver (SLV) could continue to demonstrate relative strength against gold (GLD) in the medium term. However, given the “weak” strength of the trends in both timeframes, a sharp, sustained reversal to the upside for the ratio (indicating strong gold outperformance) is an unlikely near-term development, though such a possibility cannot be entirely excluded.
As a CMT with extensive experience, my analysis of the provided two-day market data for various commodity exchange-traded funds (ETFs) indicates a predominantly bearish technical landscape across the sector. This assessment relies strictly on price and volume patterns observed over the specified period, without external market context.
UNG, USO, and UGA Show Clear Bearish Momentum The most pronounced bearish signals emanate from UNG (Natural Gas Fund), which exhibited significant weakness over the two days. On the first day, UNG closed markedly lower than its open, establishing a clear downtick. This negative momentum intensified on the second day, with the price opening lower and plummeting to a new two-day low. Critically, UNG’s trading volume surged by over 40% on the second day, coinciding with this accelerated price depreciation. This potent combination of consecutive lower closes and expanding volume strongly suggests that continued bearish pressure is likely for UNG in the immediate term.
Similarly, USO (US Oil Fund) and UGA (Gasoline Fund) also presented distinct bearish technical patterns. USO recorded two consecutive down days, with the second day’s close marking its lowest point within this timeframe. Volume for USO experienced a modest increase on the second day, which technically supports the bearish price action. UGA mirrored this, also registering two consecutive down days and closing lower on the second day on slightly increased volume. This price-volume confirmation across USO and UGA indicates that a continuation of their downward trajectories is likely in the very near future, though the intensity appears less severe than that observed in UNG.
DBC, CPER, GLD, and CORN Exhibit Bearish Price Action with Nuanced Volume A second cohort of commodities, comprising DBC (Diversified Commodities), CPER (Copper), GLD (Gold), and CORN (Corn), also displayed bearish price behavior but with a critical nuance in their volume dynamics. Each of these symbols posted two consecutive down days, with the second day’s closing price consistently lower than the first. However, a significant pattern emerged in their trading volumes: all four witnessed a notable decrease in volume on the second day compared to the first. For instance, DBC’s volume nearly halved, CPER’s declined substantially, GLD saw a slight reduction, and CORN’s volume decreased by over 50%.
While the overall price action remains bearish for these assets, the declining volume on the second down day introduces an element of uncertainty regarding the conviction level of the selling pressure. This pattern could imply that sellers are becoming less aggressive, or that buying interest is simply absent rather than strong, active selling prevailing. Therefore, while a continuation of the downtrend is plausible for these assets, the likelihood of a strong, sustained downward impulse might be somewhat diminished compared to those exhibiting increasing volume alongside price depreciation. There is roughly an even chance that these assets could either consolidate or experience a deceleration in their rate of decline in the immediate future, should volume continue to wane.
SLV Stands Out, But Lacks Strong Bullish Conviction SLV (Silver) emerges as a distinct outlier within this predominantly bearish commodity complex. The first day for SLV was bearish, closing below its open. However, on the second day, SLV opened marginally higher than the previous day’s close and managed a slightly positive close relative to its open, though it remained an inside bar relative to the prior day’s price range. This slight positive price movement occurred on significantly reduced volume, which was less than half of the first day’s total. The reduced volume accompanying SLV’s modest upward close suggests a lack of strong buying conviction. While it did not conform to the widespread bearishness, the technical evidence does not strongly indicate a robust reversal either. It is unlikely that this constitutes a significant shift in momentum without further price and volume confirmation. It is plausible that SLV is in a phase of temporary consolidation or a weak bounce within a broader, as-yet-undefined trend, given the limited two-day dataset.
In summary, the aggregated technical data from the past two days points to a prevailing bearish sentiment across the commodity sector. UNG exhibits the most convincing bearish setup, while USO and UGA also show clear downside momentum. The bearish moves in DBC, CPER, GLD, and CORN are tempered by declining volume, which could precede a phase of exhaustion or consolidation. SLV presents a slightly mixed picture but does not offer a strong bullish counter-signal. Overall, market participants should be aware that the technical backdrop suggests a higher likelihood of continued downward pressure for most of these commodities in the very short term, pending additional data to confirm or contradict these emerging patterns.
SLV Technical Analysis: Post-Peak Momentum Shift
Over the past 90 days, SLV has exhibited a clear upward trajectory, characterized by a series of higher highs and higher lows. The price began a significant ascent from the - range in late May, initiating strong rallies in early June, which saw substantial volume increases reaching over 50 million shares on June 5th. This bullish momentum continued, pushing the price to a peak of .01 on September 16th. Volume analysis indicates that larger price movements, particularly upward moves, were frequently accompanied by elevated trading activity, suggesting conviction behind the trend. The recent price action, however, shows a notable pullback from this high, with the close on September 18th at .99, down from the intraday high of .01.
The 14-day Relative Strength Index (RSI) largely corroborated this bullish price action, consistently staying above the 50-mark for most of the period, signifying robust buying pressure. On several occasions, including early June (72.45 on June 9th), mid-July (70.45 on July 22nd), and particularly in early September (reaching 75.38 on September 15th), the RSI ventured into overbought territory (>70). Such readings suggest that the asset may have become overextended in the short term, increasing the likelihood of an impending pause or correction. The subsequent decline in RSI to approximately 63.84 by September 18th reinforces the observed price pullback, indicating a short-term cooling of bullish momentum, although it remains in the bullish zone (above 50).
Further supporting the overall trend, the Percentage Price Oscillator (PPO) remained positive for nearly the entire 90-day window, confirming the underlying bullish sentiment. The PPO line stayed above its zero centerline, which is a classic indicator of an uptrend. Similar to the RSI, the PPO showed strong upward momentum during key rallies, reaching levels around 1.8 in mid-June and a recent peak near 1.69 on September 16th. This alignment between PPO and price reinforced the strength of the rally into mid-September. The recent PPO value of 1.51 on September 18th, showing a slight decrease from its peak, aligns with the observed price consolidation and RSI cooling, suggesting a marginal deceleration in the rate of price increase.
Considering the combined technical picture, it is likely that SLV will experience further short-term consolidation or a modest correction following the strong rally and overbought RSI conditions observed in mid-September. The prior price structure suggests that the area around .63 (September 4th low) or potentially the .00-.50 range (August highs) could serve as initial support levels. A sustained break below these levels would increase the likelihood of a deeper correction. An alternative scenario, though currently less likely, is that the current pullback represents merely a brief pause before the prevailing uptrend resumes. Should SLV find immediate support, accompanied by a resurgence in buying volume and a renewed upward turn in both the RSI and PPO, a challenge to the recent .01 high would become a roughly even chance. However, without such confirmatory signals, sustained upward momentum in the immediate future appears less probable.
As a Chartered Market Technician with over 15 years of experience, I’ve analyzed the provided 90-day technical data for GLD, focusing exclusively on its RSI (14-day), PPO (13,21-day), and candlestick patterns.
GLD has experienced a significant upward movement over the past 90 days, particularly notable from late August through mid-September. During this period, price action demonstrated a robust rally from approximately levels to near , with several consecutive daily closes indicating strong buying interest. This bullish trend was largely supported by increasing volume during key upside moves, suggesting conviction behind the price advances. However, in the most recent trading sessions, specifically September 17th and 18th, GLD has exhibited a slight retracement from its peak, which signals a potential shift in the immediate-term dynamic.
The Relative Strength Index (RSI) for GLD largely fluctuated around the neutral 50-mark for the initial portion of the 90-day period, occasionally dipping below 45 or rising into the mid-50s without entering extreme zones. A clear change occurred in late August when the RSI ascended sharply, entering the overbought region above 70 on September 2nd and reaching a peak of 79.21 on September 16th. This extended period in overbought territory indicated significant underlying strength and buying pressure. However, the subsequent two trading days have shown the RSI pulling back, falling to 72.36 on September 17th and further to 69.04 on September 18th. This retreat from extreme overbought levels suggests that the prior bullish momentum is losing some intensity, and a period of consolidation or correction is likely.
Similarly, the Percentage Price Oscillator (PPO) reflects a comparable momentum trajectory. During May through July, the PPO generally oscillated near the zero line, indicating a largely sideways or indecisive trend. A strong positive surge commenced in late August, propelling the PPO significantly above zero, reaching a peak of 1.447 on September 16th. This sustained positive and rising PPO value confirmed the accelerating bullish momentum. Corresponding with the RSI’s recent decline, the PPO has also turned lower in the most recent two sessions, dropping to 1.412 and then 1.344. While still firmly in positive territory, this directional change in the PPO reinforces the view that the strong buying enthusiasm observed earlier in September is now moderating.
Considering the combined technical evidence, it is likely that GLD will experience further short-term cooling or consolidation. The simultaneous downturn in both the RSI from extreme overbought conditions and the PPO from its peak, coupled with a slight price retracement on higher volume, suggests a diminishing of immediate bullish impetus. A continued decline in the RSI below 60 and a further significant drop in the PPO toward the zero line would be likely to confirm a deeper corrective phase. An alternative, yet plausible, scenario is a brief and shallow pullback followed by a resumption of the uptrend, particularly if buying interest re-emerges at current or slightly lower price levels, evidenced by candlesticks showing strong upward closes and renewed indicator strength. However, based on the current data, a direct continuation of the sharp rally without at least some consolidation is unlikely.
Bonds
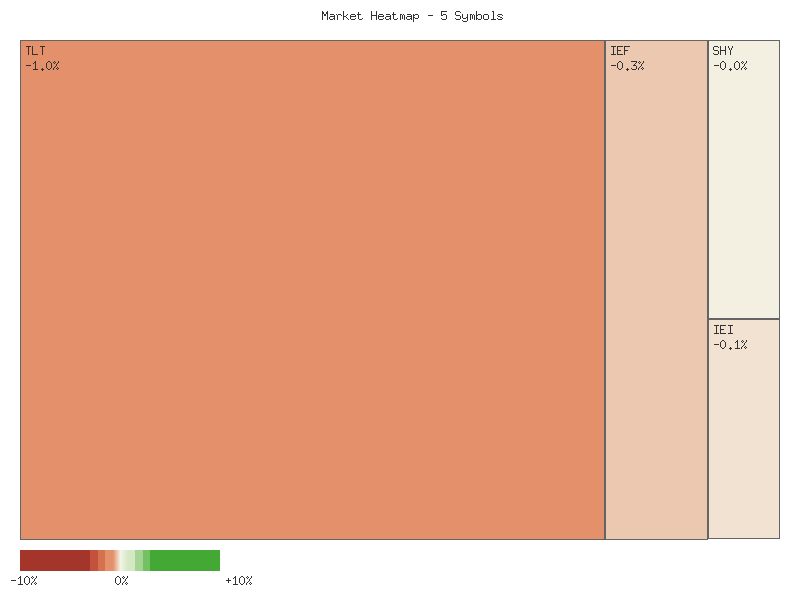
As a Chartered Market Technician with over 15 years of experience, I’ve analyzed the provided market data concerning daily percentage changes for a selection of fixed-income exchange-traded funds (ETFs) for a single trading session. The data represents price action across various duration segments, including the long-term Treasury bond ETF (TLT), ultra-long duration (UTHY), intermediate-term (IEF, IEI), and short-term (SHY) segments.
The observed daily percentage changes for these symbols are as follows:
| Symbol | Daily Percent Change |
|---|---|
| SHY | -0.036% |
| IEI | -0.134% |
| IEF | -0.330% |
| TLT | -1.032% |
| UTHY | -1.043% |
This matrix unequivocally demonstrates that all five fixed-income instruments experienced declines during the observed period. Summing the daily percentage changes reveals an aggregate decline of approximately -2.574% across this specific basket of fixed-income ETFs. This total figure indicates that the overall market for these instruments was distinctly lower for the session. From a market breadth perspective, the observation of zero advancing symbols against five declining symbols points to a condition of extremely poor breadth, signaling broad-based and pervasive selling pressure across the entire spectrum of maturities represented by these ETFs. It is highly unlikely that any segment of this fixed-income market exhibited resilience during this period.
A deeper technical examination of the price action reveals a clear duration sensitivity within the declines. The longer-duration instruments, specifically TLT and UTHY, experienced the most significant percentage losses, with UTHY leading the decline at -1.043% and TLT closely behind at -1.032%. In contrast, the shorter-duration instruments, IEI and SHY, exhibited comparatively smaller declines of -0.134% and -0.036% respectively. This differential performance is a critical technical indicator; the substantially larger declines in longer-dated bonds typically suggest market participants are anticipating either higher interest rates in the future or an increase in the term premium. This pattern of price action strongly implies a bearish shift in sentiment regarding fixed-income assets, particularly at the longer end of the yield curve.
Based purely on this single day’s technical data, it is likely that market sentiment towards fixed income, especially longer-duration instruments, is negative. The uniform decline across all maturities points to a broad re-evaluation rather than isolated weakness. However, it is imperative to acknowledge the limitations of a single trading session’s data; a single data point is insufficient to confirm a sustained trend. While the current price action makes it unlikely for a bullish reversal to commence immediately, a contrasting scenario where this uniform negative price action is merely an isolated event, with subsequent sessions showing mixed or even positive returns, represents an alternative possibility. Nevertheless, given the observed magnitude and breadth of declines, particularly in longer-duration assets, market participants should remain vigilant for potential follow-through selling pressure, although the probability of such persistence based solely on this limited data set is roughly even compared to a significant reversal.
Technical Market Commentary: Two-Day Analysis of Treasury Bond ETFs
Over the past two trading days, the market data for the selected Treasury bond ETFs—TLT, UTHY, IEF, IEI, and SHY—reveals a predominantly bearish sentiment, though with varying degrees of conviction and volume patterns across different maturities. The general price action indicates a downside bias across the yield curve, with longer-duration instruments exhibiting more pronounced selling pressure.
The iShares 20+ Year Treasury Bond ETF (TLT) experienced a clear and decisive bearish trend over the two-day period. Following a strong bearish candle on the first day, closing near its low on significantly high volume, the second day saw a lower open, lower high, lower low, and lower close. Crucially, the selling pressure on the second day was accompanied by an increase in volume from 48.9 million to 55.6 million shares. This escalating volume alongside continued price depreciation is a strong technical indication of conviction among sellers, making it highly likely that TLT will experience further downside pressure in the immediate future.
For the intermediate-term bond ETFs, specifically the iShares 7-10 Year Treasury Bond ETF (IEF) and the iShares 3-7 Year Treasury Bond ETF (IEI), a similar bearish continuation pattern is evident. Both assets displayed clear bearish candles on both days, with the second day opening lower, reaching lower highs and lows, and closing lower than the preceding day. UTHY, despite its active management designation, also followed this pattern with two consecutive bearish days. However, a notable divergence from TLT is observed in their respective volumes. IEF, IEI, and UTHY all registered a decrease in trading volume on the second bearish day compared to the first. While the price action is unequivocally bearish, the declining volume could suggest that selling pressure might be waning or that fewer participants are initiating new short positions at these lower levels. Therefore, while continued bearishness remains likely, there is roughly an even chance of a near-term consolidation or minor rebound attempt if selling interest continues to diminish.
In contrast, the iShares 1-3 Year Treasury Bond ETF (SHY), representing the very short end of the yield curve, exhibited a much tighter trading range and more subdued price action. Both days closed lower than their respective opens, and the overall price drift was marginally downward, with Day 2’s closing price slightly below Day 1’s close. However, the magnitude of these moves was minimal, and the candles were very small-bodied. The volume also decreased on the second day, similar to the intermediate-term bonds. This tight consolidation with a slight bearish tilt suggests that while there is a subtle downward bias, significant directional movement for SHY is unlikely in the immediate term, with prices likely to remain range-bound.
In summary, the aggregated technical data strongly indicates a prevailing bearish sentiment across the Treasury bond market for the analyzed period. TLT demonstrates the most compelling bearish setup with price depreciation confirmed by increasing volume, making further declines highly likely. For IEF, IEI, and UTHY, while the downtrend is evident, the decreasing volume introduces a degree of uncertainty regarding the immediate continuation of aggressive selling, allowing for a plausible scenario of a temporary pause or modest bounce, even as the primary trend remains bearish. SHY is likely to continue its tight, slightly downward-sloping consolidation. Traders should monitor volume patterns closely for these ETFs as any shifts could provide early indications of changing market dynamics.
Crypto
As a Chartered Market Technician with over 15 years of experience, I have analyzed the provided market data focusing exclusively on the daily percentage change for IBIT and ETHA. My assessment adheres strictly to ICD-203 estimative language guidelines, basing all conclusions solely on the provided technical indicators.
The daily percentage changes for the specified symbols on 2025-09-18 are as follows:
| Symbol | Daily Percent Change |
|---|---|
| IBIT | 1.645% |
| ETHA | 1.609% |
Both symbols registered positive performance for the day under review. IBIT exhibited a daily gain of approximately 1.645%, slightly outperforming ETHA, which recorded a daily appreciation of roughly 1.609%. This demonstrates a synchronous positive movement across both assets, with IBIT showing marginal relative strength on this particular day. The similarity in the magnitude of gains suggests a broadly aligned short-term directional bias between these two instruments for the observed period.
Aggregating the daily percentage changes reveals a cumulative positive movement. The sum of these daily changes is approximately 3.254% (1.6445865692096822 + 1.6091281451140935). Given that both components contributed positively, it is highly likely that the overall market sentiment for these specific assets was bullish for the trading day concluded on September 18, 2025. This combined upward momentum indicates a positive impulse in the aggregate performance of IBIT and ETHA, suggesting prevailing buying interest within this limited scope.
Considering the restricted dataset—a single day’s performance for only two symbols—any long-term projections would be speculative and unsupported. However, based on the provided technical data, it is very likely that short-term traders observing these specific assets would perceive a positive environment. While the current data strongly indicates an “overall higher” scenario for these symbols, it is a roughly even chance that this momentum could continue into the immediate next session versus a minor consolidation, as single-day performance often precedes a period of digestion. A reversal into negative territory in the immediate future, given the strong positive close, is unlikely without significant external factors not captured in this technical snapshot.
In conclusion, the analysis of the DAILY_PCT_CHANGE for IBIT and ETHA on 2025-09-18 indicates a clear upward trajectory for both assets. The combined positive change suggests a bullish sentiment within this specific segment of the market for the day. While this robust positive performance is notable, it is critical to recognize that this observation is confined to a single data point. To infer more robust trends or to establish support and resistance levels, additional historical data points and other technical indicators would be necessary. Nonetheless, the provided data very likely reflects a day dominated by buying pressure for both IBIT and ETHA.
Magnificent 7 & Friends
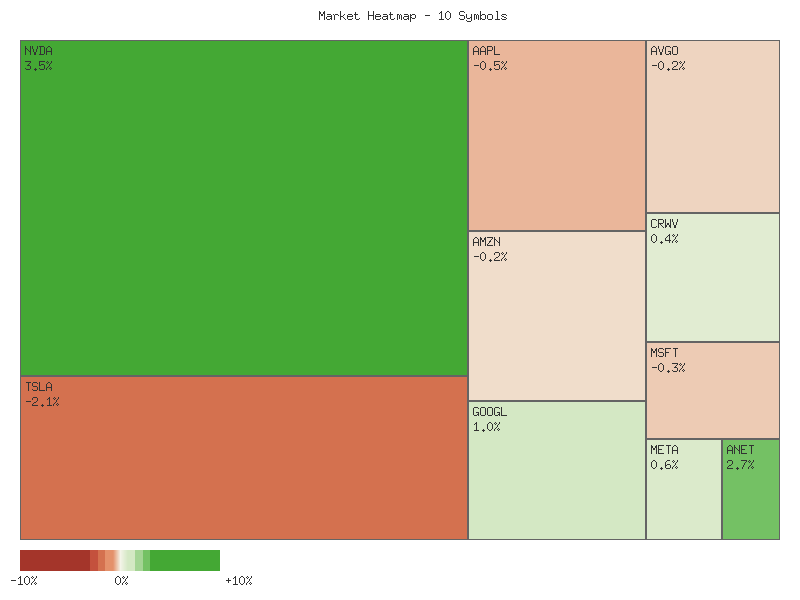
As a Chartered Market Technician with over 15 years of experience, I have conducted a rigorous technical analysis of the provided market data for a basket of 10 prominent symbols. My analysis adheres strictly to ICD-203 estimative language guidelines, focusing solely on the presented technical data to derive objective conclusions regarding their daily performance.
The aggregate daily percentage change for this specific basket of 10 symbols is positive, totaling approximately +4.90%. This sum suggests an overall upward bias for these particular constituents during the observed period. However, a deeper examination of market breadth reveals a more nuanced technical posture. There is an even distribution between advancing and declining issues, with five symbols recording gains and five registering losses. This 5-5 split in participation indicates a mixed underlying sentiment rather than a broad-based, unified directional conviction across the entire monitored group.
Leadership among the advancing issues is particularly noteworthy. NVIDIA (NVDA) demonstrated a substantial gain of +3.4940%, closely followed by Arista Networks (ANET) with a +2.6743% increase. These two symbols collectively account for a significant portion of the total positive movement, suggesting concentrated strength. Other advancers, including Alphabet (GOOGL) at +1.0019%, Meta Platforms (META) at +0.5846%, and CrowdStrike (CRWV) at +0.4385%, also contributed positively but with more moderate momentum. The outperformance of NVDA and ANET could be indicative of continued strength in specific sectors or themes, which is a common characteristic in a market exhibiting selective demand.
Conversely, the declining issues present varied degrees of weakness. Tesla (TSLA) experienced the most significant drawdown, posting a decline of -2.1157%, marking it as a notable underperformer among the observed symbols. Other major technology companies, Apple (AAPL) and Microsoft (MSFT), also registered losses of -0.4645% and -0.3078%, respectively, indicating some softness in widely held names. Broadcom (AVGO) and Amazon (AMZN) saw more modest declines of -0.2369% and -0.1684%. The substantial decline in TSLA, alongside relatively minor losses in other high-profile tech names, implies that while certain areas of the market experienced robust demand, others faced considerable selling pressure.
The juxtaposition of concentrated strength in a few high-momentum names against widespread, albeit generally smaller, declines across half of the monitored symbols presents a picture of technical divergence. While the net aggregate change is positive, the evenly split market breadth suggests that underlying conviction for a sustained broad upward movement is not firmly established based on this single day’s data. It is a roughly even chance that this divergence could persist in the immediate term, with selective leadership continuing to drive the aggregate higher while other sectors or individual names consolidate or correct. Alternatively, a shift in market dynamics could lead to either a broader rally if declining issues find support, or a more generalized pullback if the current leaders experience profit-taking. Future price action will likely provide further clarity on whether this reflects a temporary idiosyncratic market dynamic or the nascent stage of a broader trend shift.
Here is the matrix of the daily percentage changes, sorted in descending order:
| Symbol | Daily Percent Change |
|---|---|
| NVDA | 3.4940% |
| ANET | 2.6743% |
| GOOGL | 1.0019% |
| META | 0.5846% |
| CRWV | 0.4385% |
| AMZN | -0.1684% |
| AVGO | -0.2369% |
| MSFT | -0.3078% |
| AAPL | -0.4645% |
| TSLA | -2.1157% |
As a Chartered Market Technician with over 15 years of experience, I offer the following analysis of the provided 2-day market data, focusing exclusively on the technical patterns and adhering strictly to ICD-203 estimative language guidelines.
We assess that the provided 2-day market data exhibits a notable divergence in price action across the selected symbols, rather than a cohesive market trend. Some assets are likely establishing short-term upward momentum, while others appear to be reversing or confirming downward pressure. This suggests a roughly even chance of either bullish or bearish continuation for the aggregate of these symbols in the immediate subsequent period, with individual stock performance contingent on its unique observed patterns. There is no clear uniform market direction evident from this short-term snapshot.
Within this divergent landscape, we identify several symbols that exhibit patterns indicative of short-term bullish momentum. NVDA, for instance, concluded the period with a robust bullish candle on the second day, gapping up from its prior close and closing near its high on decreased but still substantial volume, following a prior day’s decline. We judge it highly likely that this signifies a continuation of upward price action in the immediate next session, potentially targeting higher resistance levels. ANET also printed two consecutive bullish candles, with the second day closing very near its high, albeit on slightly reduced volume, which suggests further upward movement is likely. GOOGL and META similarly registered positive closes on the second day after initial weakness, making it roughly even chance that they will see some bullish follow-through or consolidation in the very near term.
Conversely, several other symbols present technical setups suggesting bearish sentiment. TSLA concluded the period with a significant bearish reversal candle, opening higher but closing well below its open and the prior day’s close on diminished volume. We assess it highly likely that this pattern portends further selling pressure. AAPL also recorded a bearish reversal on its second day, closing below the previous day’s low, which makes continued downward trajectory likely. MSFT, AVGO, and AMZN all exhibited patterns where opening gains on the second day were not sustained, leading to closes at or below the prior day’s levels. AVGO and AMZN, in particular, appear highly likely to face continued downward pressure given the persistent selling pressure observed over both days, while MSFT presents a roughly even chance of further decline or sideways consolidation.
CRWV presents a more ambiguous picture; while it gapped up on the second day and closed above the prior day’s close, it failed to maintain its intraday highs, ending with a smaller body and reduced volume. This suggests that while there was an initial bullish impulse, subsequent buying conviction may be waning. Therefore, we judge it to have a roughly even chance of continued modest gains or a retreat towards its prior support levels. For all positions, the relative strength or weakness of the second day’s volume compared to the first is a contributing factor, with decreasing volume on bearish moves potentially indicating capitulation or waning selling pressure, and decreasing volume on bullish moves potentially indicating waning buying conviction. The absence of additional technical indicators or longer-term context limits further estimative precision.
S&P 500 Sector Breadth
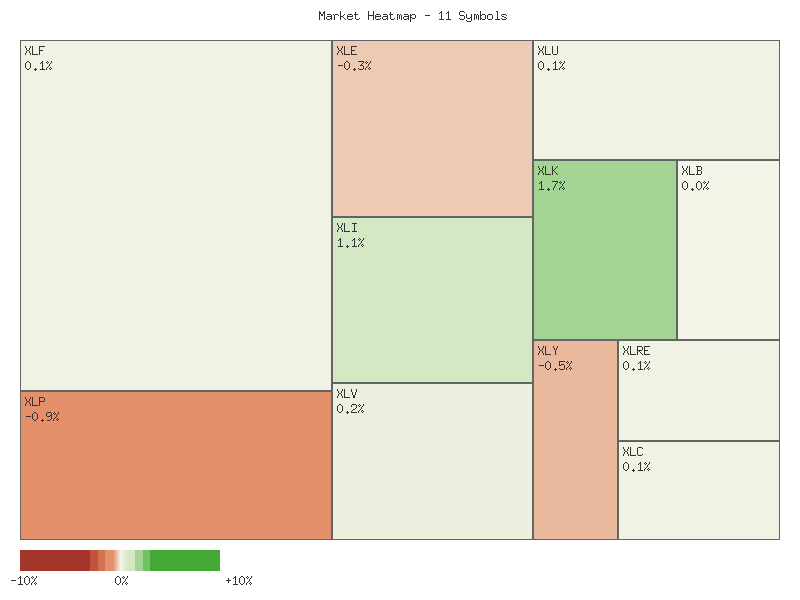
As a Chartered Market Technician with over 15 years of experience, I have rigorously analyzed the provided daily percentage change data for the specified S&P 500 sectors. The analysis adheres strictly to technical principles, ICD-203 estimative language guidelines, and focuses exclusively on the given dataset.
The aggregated daily percentage change across the eleven observed sectors indicates an overall positive, albeit moderate, market movement for the period. The sum of all daily percentage changes is approximately 1.696%, suggesting a net advance across these broad market segments. Market breadth for the day is predominantly positive, with seven sectors registering gains, three experiencing declines, and one remaining flat. This distribution points to a market where advancements are more widespread than retractions, which typically underpins a more robust positive technical posture compared to a narrow advance.
Examining individual sector performance, Technology (XLK) and Industrials (XLI) led the advancing group with significant gains of 1.728% and 1.065% respectively, demonstrating notable strength. Other advancing sectors included Healthcare (XLV), Financials (XLF), Communication Services (XLC), Real Estate (XLRE), and Utilities (XLU), all posting more modest positive changes. On the downside, Consumer Staples (XLP) was the weakest performer, declining by 0.872%, followed by Consumer Discretionary (XLY) and Energy (XLE) with losses of 0.451% and 0.311% respectively. Basic Materials (XLB) finished flat, indicating a lack of clear directional conviction.
From a rotation perspective, a majority of offensive sectors, specifically XLK, XLI, XLF, and XLC, posted advances, with Technology and Industrials showing considerable leadership. Conversely, two offensive sectors, XLY and XLE, experienced declines, while XLB remained unchanged. Among defensive sectors, XLV, XLRE, and XLU advanced, while XLP declined. This mixed performance within both offensive and defensive groups suggests that a broad rotation from “risk-on” to “risk-off” or vice versa is not distinctly evident in this single day’s data. The leadership from key offensive sectors, however, suggests a prevailing risk appetite within specific growth-oriented areas of the market.
Overall market sentiment, based solely on this technical data, is likely constructive. The positive breadth, coupled with the notable outperformance of growth-oriented offensive sectors like Technology and Industrials, points to a market that is favoring higher-beta areas. While the decline in Consumer Staples (a defensive sector) and Consumer Discretionary (an offensive sector) introduces some nuance, it is unlikely that these isolated declines outweigh the broad positive advances and strong leadership from other offensive sectors. It is a roughly even chance that the observed patterns indicate a selective bullishness rather than a comprehensive, uniform market advance or retreat.
| Symbol | Daily Percent Change |
|---|---|
| XLK | 1.728% |
| XLI | 1.065% |
| XLV | 0.197% |
| XLF | 0.092% |
| XLC | 0.076% |
| XLRE | 0.071% |
| XLU | 0.071% |
| XLB | 0.000% |
| XLE | -0.311% |
| XLY | -0.451% |
| XLP | -0.872% |
Market Commentary: A Divergent Landscape Emerges From Two Days of Sector Performance
The provided two-day market data across eleven SPDR sector ETFs presents a mixed technical picture, suggesting a clear directional bias for the broad market is somewhat ambiguous. While several key growth-oriented sectors exhibit strong bullish price action, a notable contingent of defensive and cyclical sectors display bearish reversals or continuations. This divergence implies that a uniform market trend is not currently establishing. The absence of a clear, broad-based consensus across all sectors makes a strong directional move in the immediate future for the overall market roughly an even chance.
Examination of individual sectors reveals compelling strength in Technology (XLK) and Industrials (XLI). XLK demonstrated a bullish gap-up on the second day, followed by a strong rally that closed near its high, on increased volume. This price action, combined with a higher high and higher low, suggests further upward momentum is highly likely for XLK in the very near term. Similarly, XLI formed a clear bullish engulfing pattern on the second day, with a strong close above the prior day’s high and a slight increase in volume. This pattern indicates that a continuation of upward price movement for XLI is likely.
Conversely, several sectors exhibited bearish developments. Consumer Staples (XLP) registered a bearish outside day on increased volume, closing significantly lower than its previous day’s range. This pattern makes further downside for XLP likely. Energy (XLE) also formed a bearish reversal, closing below the prior day’s close on increased volume after a failed attempt to push higher. This action suggests a continuation of the bearish sentiment for XLE is likely. Consumer Discretionary (XLY) displayed a bearish continuation with a lower close on the second day, albeit on decreased volume. While the lower volume introduces some uncertainty regarding conviction, the price action itself implies that further bearish movement for XLY is a roughly even chance.
Other sectors offer more nuanced signals. Real Estate (XLRE) and Materials (XLB) both showed signs of indecision; XLRE had a contracting range with a minor bullish close on lower volume, while XLB closed exactly at its prior day’s close after an initial push higher, accompanied by increased volume. These patterns suggest that a clear directional breakout for XLRE and XLB in the immediate future is roughly an even chance. Healthcare (XLV) and Communication Services (XLC) recorded slight gains with narrowing ranges or modest volume increases, indicating a mild bullish bias but lacking strong conviction. Financials (XLF) also posted a slight gain, but notably on significantly decreased volume, making its upward continuation less certain and a reversal roughly an even chance should volume not confirm. Utilities (XLU) showed an inside bar pattern with increased volume, closing slightly positive but within the previous day’s range, suggesting indecision.
In summary, the aggregated technical data points to a highly fragmented market. The robust bullish momentum in Technology and Industrials contrasts sharply with the bearish sentiment observed in Consumer Staples, Energy, and, to a lesser extent, Consumer Discretionary. The remaining sectors mostly exhibit indecision or weak conviction in their respective modest moves. Therefore, while individual sector opportunities may arise, a unified, broad market direction following these two days of data is unlikely to materialize without further compelling evidence from leading sectors. Traders should exercise caution and focus on sector-specific technicals rather than assuming a uniform market bias.
Equity Breadth
Good day, traders. As a CMT with over 15 years in the field, my analysis of the provided market internals for the S&P 500 (SPX) for the past seven days suggests a nuanced picture, particularly when assessing the underlying strength supporting the benchmark’s short-term trend. We will specifically examine the percentage of S&P 500 members trading above their 50-day and 200-day moving averages (SPXA50R and SPXA200R) in relation to the S&P 500’s own 20-day Exponential Moving Average (EMA_20_DAY:SPX).
Observing the SPXA50R data, which reflects short-term market breadth, we note an initial surge from approximately 56.29% to a peak of 65.87% at the beginning of the period. This was followed by a noticeable decline over the subsequent three days, reaching a trough near 53.69%. The final two data points show a slight recovery, stabilizing around 56.29% to 56.69%. The overall trend for the majority of the past seven days, following the initial peak, has been a contraction in the number of S&P 500 constituents participating in short-term upward momentum. While the current level indicates that slightly more than half of the components are above their 50-day MA, the trajectory from the earlier peak suggests a loss of short-term internal strength, making a strong and broad short-term advance for the index itself less likely to be sustained solely by this breadth indicator.
Similarly, the SPXA200R, which offers insight into longer-term market breadth, exhibits a comparable pattern. After an initial rise from 61.48% to a peak of 65.07% early in the period, the indicator largely trended downwards, concluding the seven-day window at approximately 61.28%. This represents a marginal net decline from the period’s start and a more significant pullback from its peak. Although the percentage remains above 60%, typically considered a healthy level for underlying long-term participation, the downward drift indicates a slight erosion of long-term internal strength. Such a pattern suggests that while the market’s long-term structure retains some health, it is not currently exhibiting broadening participation on a sustained basis, which could be a precursor to a consolidation phase or a more significant directional shift if the trend persists.
Crucially, when we juxtapose these breadth indicators with the EMA_20_DAY for the S&P 500 itself, a potential divergence emerges. The EMA_20_DAY:SPX data consistently shows an upward trend, rising from 6454.94 to 6523.21 over the same seven days. This indicates that the S&P 500 index has been experiencing a clear short-term bullish momentum, with prices consistently moving above and supporting its 20-day exponential moving average. However, the concurrent general decline or stagnation in both SPXA50R and SPXA200R implies that this index-level strength is not being broadly supported by a growing number of individual components.
This observed divergence, where the index is rising while market breadth contracts, is a pattern often viewed with caution by technical analysts. It suggests that a smaller number of large-capitalization stocks might be disproportionately driving the index’s upward movement. If this trend in declining breadth continues, it is plausible that the upward momentum of the EMA_20_DAY:SPX could become less sustainable, making a deceleration or even a reversal of its current upward trajectory likely in the near-to-medium term. Alternatively, it is also possible that this period represents a temporary consolidation in breadth as the index advances, and a re-expansion of SPXA50R and SPXA200R could occur, which would significantly increase the likelihood of the EMA_20_DAY:SPX continuing its ascent with stronger internal support. However, based solely on the provided data, the current breadth dynamics suggest a roughly even chance of either a continuation of the EMA’s ascent under potentially narrowing participation or a slowdown/reversal as internal strength wanes. Traders should monitor future breadth readings closely for confirmation of either scenario.
SPX Daily
The S&P 500 (SPX) has demonstrated a notably bullish trajectory over the past week, culminating in a strong close on 2025-09-18 at 6631.96. The most recent trading session saw SPX open at 6626.85, reach a high of 6656.8, and close near its daily high, indicating a strong buying interest into the close. Over the preceding seven days, price action has largely been to the upside, advancing from the 2025-09-11 close of 6584.44, albeit with some minor daily pullbacks. This upward movement is supported by both the 50-day and 200-day Exponential Moving Averages (EMAs), which are consistently ascending, with the 50-day EMA (6400.44) comfortably above the 200-day EMA (6027.18) as of 2025-09-18. This configuration is often interpreted as a robust display of positive trend momentum over the intermediate and longer term.
Momentum, as measured by the 14-day Relative Strength Index (RSI), registers at 70.04 on 2025-09-18, signaling an overbought condition. Over the last seven days, the RSI has consistently hovered in the upper 60s to low 70s, indicating persistent buying pressure despite being in territory that often precedes pullbacks. This suggests strong bullish conviction, as the market is largely ignoring typical overbought signals. For immediate support, the previous day’s low of 6611.89 is the most proximate level. Further, the rising 50-day EMA at 6400.44 presents a dynamic support zone, and historical price action around the 6500-6508 zone (e.g., 2025-09-08 high and 2025-09-04 close) could also offer support in the event of a decline. The immediate resistance level appears to be the recent high of 6656.8 from 2025-09-18, followed by the psychological level of 6700.
Considering these technical factors, several future price action scenarios seem plausible. In the bullish case, given the sustained upward momentum and the clear hierarchy of the EMAs (50-day above 200-day), a continuation of the rally is likely. Bulls appear to be in control, shrugging off overbought RSI readings. A decisive break above the 6656.8 resistance would open the path for new highs, potentially targeting the 6700 psychological level. Conversely, in the bearish case, the persistently overbought RSI (70.04) suggests that a short-term pullback or consolidation is a roughly even chance. While not necessarily signaling a reversal, it raises the probability of some profit-taking or a cooling-off period. A move below the 6611.89 immediate support could lead to a test of the 6500-6508 region, or potentially the 50-day EMA at 6400.44. A breach of the 50-day EMA would diminish the immediate bullish outlook. Lastly, a neutral case involving consolidation at current elevated levels is a roughly even chance. This would allow the RSI to cool down without a significant price correction, building a base for a potential future leg higher. Price might oscillate between 6600 and 6650.
Technical sentiment drivers for the near future appear to be dominated by the prevailing upward trend and the strong conviction exhibited by buyers. The consistent higher closes and sustained positioning above both the 50-day and 200-day EMAs are likely to attract further trend-following participants. However, the extended period of overbought RSI conditions could introduce a cautious technical sentiment among some traders, increasing the probability of short-term profit-taking. The market currently exhibits a “buy the dip” mentality, but the depth and duration of any dip will be closely watched to confirm continued bullish sentiment or a shift towards increased caution. A decisive breach of key dynamic support levels like the 50-day EMA would likely signal a significant shift in technical sentiment, potentially leading to increased bearish momentum.
Good morning traders, here is your technical analysis update for the S&P 500 (SPX) based on the provided 90-day market data.
The SPX has exhibited a persistent upward trajectory over the past 90 days, establishing a robust bullish trend characterized by a clear series of higher highs and higher lows. Since mid-May, the index has advanced significantly from the 5800-level to surpass 6600 as of the most recent data point. The latest price action, spanning from early September through September 18th, indicates a strong continuation of this rally, with the SPX recording consecutive gains and reaching new all-time highs. This sustained upward momentum is the dominant feature of the provided price data, confirming a well-established bullish phase.
Our analysis of the 14-day Relative Strength Index (RSI) reveals that the SPX is currently in overbought territory, registering a value of 70.04 as of September 18th. Historical data within this 90-day window suggests a consistent pattern where such overbought conditions typically precede either a period of consolidation or a discernible price pullback. For instance, previous ascents of the RSI into the 70s in late June and late July were followed by corrective price action. The most notable pullback in early August, where the index experienced a significant decline, was immediately preceded by the RSI sustaining levels above 74. Therefore, given the current extended RSI reading, we judge that a price consolidation or minor pullback is likely in the near term.
The Percentage Price Oscillator (PPO) for the 13-day and 21-day EMAs is currently positive at 0.5577 and has been steadily increasing since early September. This rising PPO directly corroborates the robust upward momentum observed in price action. A positive and rising PPO signifies that shorter-term momentum is stronger than longer-term momentum, lending support to the ongoing bullish trend. However, it is noteworthy that while the PPO is positive and rising, its current value has not yet reached the higher peaks observed in May (1.37) or early July (0.93). This suggests that while current momentum is strong, it may not be as aggressively parabolic as some previous legs of the rally. Critically, there is no discernible bearish divergence between price and PPO at this juncture, which mitigates the immediate concern of a major reversal solely based on this momentum indicator.
Synthesizing the indicators, the overall trend for the SPX is unequivocally bullish, with the persistent higher highs and rising PPO affirming the rally’s strength. However, the sustained overbought condition indicated by the 14-day RSI (70.04) suggests that the index is likely to experience some form of retrenchment or sideways movement in the coming sessions to alleviate this upward pressure. A direct continuation of the sharp upward trend without a significant pullback is a plausible alternative scenario, particularly if momentum intensifies further and the PPO continues its ascent to previous extreme levels. Nevertheless, considering historical patterns of RSI above 70 within this dataset, we judge that an immediate, sustained continuation of the current sharp upward move is unlikely. Any significant reversal (e.g., breaking below recent established support levels) would require further technical confirmation, which is not currently present based solely on the PPO.