[TEST] Daily Market Technical Analysis
Daily Market Technical Analysis
Market Overview
Executive Summary: Daily Market Technical Analysis (September 17, 2025)
The market presented a mixed technical landscape on September 17, 2025, marked by widespread index declines and negative breadth, despite a notable VIX drop suggesting a roughly even chance of stabilization. Large-cap indices like SPY and QQQ face likely continued selling pressure, while mid- and small-caps show clear rejection of higher prices, making sustained immediate upside unlikely. Commodities and precious metals are largely under bearish pressure, with GLD and SLV likely experiencing further short-term downside. All bond ETFs demonstrated strong bearish reversals on increasing volume, indicating highly likely continued price depreciation across durations. The S&P 500 maintains a dominant bullish long-term trend, with continued upside likely; however, weakening internal breadth suggests increasing challenges for sustained rallies. Sector performance remains highly divergent, with Financials and Consumer Staples showing bullish conviction while Technology and Industrials face likely continued downward pressure.
Market Indices
Market Commentary: Technical Analysis of September 17, 2025 Market Data
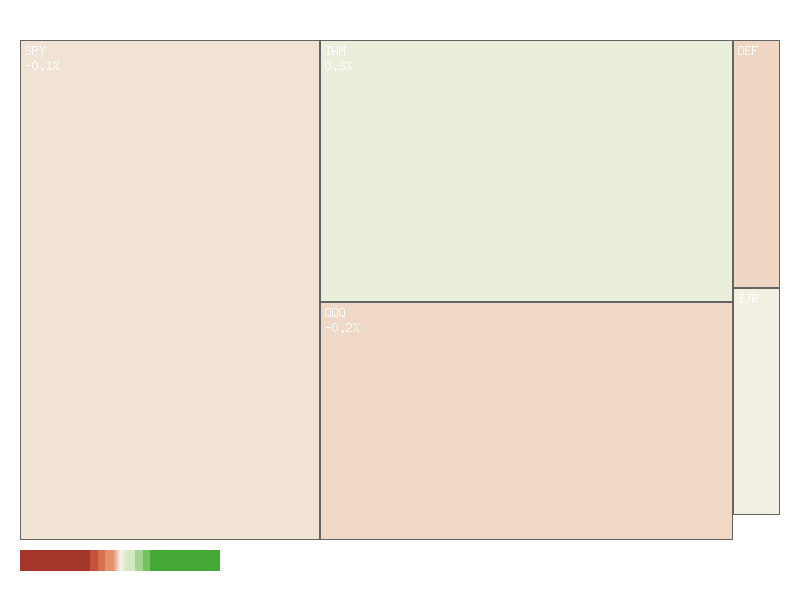
A review of the provided market data for September 17, 2025, reveals a predominantly negative sentiment across several key indices, although with a notable divergence in volatility indicators. The daily percent changes for selected broad market and sector-specific Exchange Traded Funds (ETFs) and indices are presented below, sorted in descending order:
| Symbol | Daily Percent Change |
|---|---|
| IWM | +0.256% |
| IJR | -0.025% |
| MDY | -0.087% |
| SPX | -0.097% |
| QQQ | -0.200% |
| OEF | -0.212% |
Considering the aggregate daily performance of these six key symbols, the market experienced an overall modest decline, summing to approximately -0.365%. This collective movement suggests a lower directional bias for the day across these representative segments. Furthermore, market breadth indicators for this set of symbols point to a weak underlying participation. Only one out of the six symbols (IWM) posted a gain, while five experienced declines. This 1:5 advance/decline ratio indicates narrow market breadth, with the small-cap Russell 2000 ETF (IWM) showing resilience, while mid-caps (MDY), large-cap (SPX, OEF), and tech-heavy (QQQ) indices faced selling pressure. Such divergence, particularly when broader market indices are down, is typically viewed with caution, suggesting that the broader market may lack conviction.
The Cboe Volatility Index (VIX) daily data provides a nuanced perspective on market sentiment. On September 17, 2025, the VIX recorded a significant daily decrease of approximately -3.912%. This substantial single-day drop in implied volatility might ordinarily accompany a strong upward movement in equity markets or a significant reduction in perceived risk. However, given that the majority of the analyzed equity indices closed lower, this presents a divergence between implied volatility and immediate market price action. Such a scenario may indicate that while prices moved lower, the rate of expected future price swings decreased, possibly signaling that market participants perceive the current downturn as transient or not indicative of escalating systemic risk.
Reviewing the VIX candle data over the past seven days (September 9-17) offers additional context. The VIX largely trended upward from a close of 15.04 on September 9 to a peak close of 16.36 on September 16, consistent with increasing market uncertainty over the period. The candle for September 17 opened at 16.42, made a high of 16.75, but closed significantly lower at 15.72, near its daily low of 15.26. This bearish candle on the VIX chart, coupled with the -3.912% daily change, suggests a rapid unwinding of some previously built-up implied volatility. Despite the majority of equity indices showing declines, the VIX’s retracement implies that a reduction in fear or uncertainty has taken place. It is therefore a roughly even chance that this VIX behavior points to either a temporary pause in market anxiety or a potential stabilization phase for equities, even if the current day’s price action was predominantly negative. A sustained decline in the VIX, particularly if accompanied by a bottoming out or reversal in equity indices, would be a more compelling signal for a potential shift in market posture.
As a Chartered Market Technician with over 15 years of experience, I’ve analyzed the provided two-day market data for SPY, QQQ, IWM, IJR, MDY, and OEF using rigorous technical analysis principles.
Major Index Performance and Downward Pressure
Analysis of the provided two-day data for the major market indices, SPY, QQQ, and OEF, reveals a consistent pattern of downward pressure. On the first day, all three exhibited relatively tight trading ranges with minor closes below their opens. The second day, however, witnessed a significant expansion in trading ranges for SPY and QQQ. Both opened near their prior day’s close but experienced notable intra-day selling, pushing prices substantially lower before a partial recovery. SPY closed below its prior day’s close on expanded volume, indicating a likely presence of bearish conviction. Similarly, QQQ closed lower than its prior day’s close on significantly higher volume, which also points to likely continued selling pressure. OEF, while showing an expanded range and a close below its previous day, did so on markedly reduced volume. This divergence in volume for OEF suggests that while selling pressure was evident, the conviction behind the move was unlikely to be as strong as seen in SPY and QQQ. Based purely on these patterns, it is likely that these major indices face immediate technical headwinds.
Mid and Small-Cap Indices Encounter Resistance
In contrast to the clear downward pressure observed in large-cap indices, the mid and small-cap segments, represented by IWM, IJR, and MDY, displayed a different dynamic during the second trading day. After relatively contained price action on the first day, these indices attempted significant intra-day rallies. IWM, MDY, and IJR all saw their prices move substantially higher from their opens, piercing well above their previous day’s highs. However, these rallies were consistently met with strong selling pressure, leading to significant reversals from their intra-day highs and forming pronounced upper shadows on their candlesticks. IWM managed to close marginally above its previous day’s close on increased volume, suggesting a roughly even chance for a retest of the intra-day high but also reflecting strong resistance. IJR and MDY, despite their strong intra-day moves, closed slightly below their previous day’s close. IJR’s reversal occurred on decreased volume, making a strong bullish follow-through unlikely. MDY’s reversal on increased volume, similar to IWM, indicates strong supply emerging at elevated price levels, making a sustained immediate upside push unlikely. These long upper shadows are classic technical indicators suggesting buyers were unable to sustain higher prices, and strong selling emerged, establishing potential near-term resistance levels.
Intermarket Implications and Short-Term Outlook
Synthesizing the performance across these different market segments provides a nuanced but generally cautious outlook. The weakness and increased selling volume in large-cap indices (SPY, QQQ) combined with the clear rejection of higher prices in mid and small-cap indices (IWM, IJR, MDY) on the second day creates an environment where further upside momentum is unlikely in the immediate term. The patterns suggest that any rallies are prone to encountering selling pressure. For SPY and QQQ, the expanded ranges on increased volume signify the bears currently exerting control, and a continuation of this downward pressure is likely. Conversely, while IWM, IJR, and MDY showed resilience by attempting rallies, the pronounced upper shadows demonstrate that supply is readily available above the recent closing prices. It is a roughly even chance that these mid and small-cap indices will experience a period of consolidation or a test of lower support levels, given the strong rejection from their intra-day highs. An alternative scenario could see these indices retesting their day-two highs; however, overcoming such resistance would require significant buying volume, which was not sustained. Overall, the technical landscape across these ETFs points to a market facing challenges in sustaining upward momentum, with a highly likely potential for continued volatility and further downside probes in the very near term.
SPX Technical Analysis: Mid-September 2025 Outlook
Over the past 90 days, the S&P 500 (SPX) has exhibited a dominant bullish trend, characterized by a clear pattern of higher highs and higher lows. Significant upward movements were observed from early May, peaking in mid-May, followed by another sustained rally from early June through early July, and most recently, a robust surge from late August through mid-September. Periods of pullback or consolidation, such as those experienced in late May, mid-June, and early August, were consistently met with renewed buying interest, ultimately leading to the establishment of new price highs. The latest data point shows the SPX closing near its all-time high within this period, indicating persistent underlying strength.
Current momentum indicators largely affirm this prevailing bullish outlook. The 14-day Relative Strength Index (RSI) is presently at 67.24, signaling strong upward momentum for the SPX. Importantly, this value remains below the conventional overbought threshold of 70+, where prior rallies within this 90-day window have frequently encountered resistance or initiated short-term consolidations. Concurrently, the 13-21-day Percentage Price Oscillator (PPO), currently at 0.536, has demonstrated a distinct upward trajectory since early September from its August lows, effectively confirming the recent acceleration in price. Given these concurrent bullish signals from both price action and momentum, continued upward momentum for the SPX is likely in the immediate term.
Despite the current bullish sentiment, market participants should consider several technical factors that could temper the rally or lead to a temporary pause. The RSI, while not yet at extreme levels, is approaching the upper bounds where past rallies have often experienced short-term consolidation or minor pullbacks; for instance, the RSI reached approximately 75 in late June and 76 in late July before price cooled. Should the RSI push further into overbought territory (above 70) in the coming days, a temporary deceleration or modest price retreat is a roughly even chance. Furthermore, a careful examination of the PPO reveals that its current peak of 0.536 is notably lower than previous highs observed in May (1.37) and July (0.94). This pattern of lower PPO highs, even amidst an upward price trend, could imply that the current bullish momentum, while present, may possess somewhat weaker underlying force compared to earlier, more aggressive rally phases. Consequently, it is a roughly even chance that the rate of ascent in this current leg may moderate or prove less sustained than previous strong surges without a corresponding acceleration in the PPO.
In conclusion, the SPX is likely to attempt further upside in the near term, buoyed by recent strong price action and supportive momentum indicators. However, market participants should remain vigilant of the RSI’s proximity to potentially overbought conditions, which presents a roughly even chance of a short-term consolidation or pullback. The observed relatively lower peak in the PPO compared to previous rallies suggests it is a roughly even chance that the current upward trajectory may be less aggressive or durable than prior extensions. The dominant trend remains bullish, but these subtle indicator divergences warrant a cautious perspective on the immediate sustainability and magnitude of the rally without additional technical confirmation.
<style> .container {display: flex;justify-content: center;align-items: center;} .item {margin: auto;} </style>
<div style="widht:auto">
</div>
As a CMT with extensive experience, I provide the following technical analysis for QQQ based solely on the provided 90-day market data, employing rigorous technical analysis principles and ICD-203 estimative language.
QQQ has demonstrated a clear upward trajectory over the past 90 days, advancing from approximately in early May to recent levels near . This robust underlying bullish bias for the period is evident, marked by a series of higher highs and higher lows despite several significant pullbacks. Key support levels appear to have been established around the - range following the sharp corrections observed in late July and mid-August. Conversely, the immediate resistance is currently being tested around the recent peak of .79 observed on September 15th, representing a critical level for near-term price action.
The 14-day Relative Strength Index (RSI) reveals periods of strong, sustained bullish momentum. During late May and particularly in late June and throughout July, the RSI repeatedly entered and lingered in overbought territory (above 70), peaking at 73.11 on July 28th. Historically, these extended overbought conditions were often followed by corrective phases, as evidenced by the sharp drop in RSI to 48.26 in early August. More recently, the RSI climbed steadily from an oversold condition (47.05 on August 21st and 47.36 on September 2nd) to 69.81 on September 15th, just shy of the overbought threshold. The subsequent minor price decline on September 16th and 17th led to a slight retreat in RSI to 67.04. This suggests a roughly even chance of either a continued push into overbought territory or a period of consolidation, as buying pressure appears to have slightly abated at the most recent peak.
The 13-21-day Percentage Price Oscillator (PPO) offers critical insights into momentum dynamics. A significant observation is the bearish divergence that materialized in July; while QQQ’s price made a higher high on July 29th (high of .11) compared to July 3rd (high of .2), the PPO simultaneously registered a lower high (0.83 on July 29th versus 1.09 on July 3rd). This bearish divergence highly likely indicated a weakening in bullish momentum, which was subsequently confirmed by the sharp price decline and PPO drop to 0.60 on August 1st. Following the mid-August pullback, the PPO dipped close to the zero line, reaching its lowest point at 0.17 on September 3rd, reflecting significantly diminished bullish momentum. However, since September 3rd, the PPO has shown a clear upward trend, currently at 0.60 on September 17th, and remains positive. This re-establishment of positive and rising momentum makes a continuation of the upward price trend likely in the immediate future.
Based on the convergent technical signals, QQQ is likely to maintain its constructive posture. The PPO’s current positive and rising trajectory, coupled with the RSI holding strong above its neutral zone, indicates prevailing bullish momentum. However, considering the RSI’s proximity to overbought conditions on September 15th and its subsequent slight retreat, a short-term consolidation or minor pullback is a roughly even chance. Should QQQ fail to break convincingly above the .79 resistance level, the previous highs around .35 and .11 could potentially serve as near-term support levels. A more pronounced decline, indicated by the PPO crossing below zero or the RSI dropping significantly below 50, appears unlikely in the near term but would warrant a reassessment of the prevailing trend. The notable high volume observed during previous sharp declines (e.g., July 31st and August 1st, August 20th) suggests that strong selling pressure can emerge rapidly from elevated levels. Therefore, while continued upside is likely, vigilance for signs of momentum deceleration, such as a PPO bearish divergence or a definitive break of recent support levels, remains prudent.
<style> .container {display: flex;justify-content: center;align-items: center;} .item {margin: auto;} </style>
<div style="widht:auto">
</div>
Technical Analysis of IWM (Russell 2000 ETF)
Over the past 90 days, IWM has exhibited significant price volatility and distinct shifts in momentum, culminating in a broad upward trend since early August. In mid-May, IWM reached a peak around 209-210 before experiencing a notable decline into late May, finding support in the 202-205 range. A subsequent rally in late June and early July saw the ETF climb to approximately 223-226, establishing a temporary high before undergoing another, more substantial pullback that bottomed around 214-215 in early August. Since then, IWM has been in a sustained uptrend, recently trading near the 238-239 level. The candle data for September 17 shows a broad range day with a high of 244.28 and a close at 238.89 on elevated volume (79.8 million shares), which suggests strong intraday activity and potential profit-taking pressures at higher price levels.
The PPO_13_21_DAY indicator provides clear insights into momentum. A robust bullish momentum peaked around 1.3 in mid-May, followed by a sharp reversal that saw the PPO decline into bearish territory, hitting a low of approximately 0.08 by early August. This period corresponded with the aforementioned price troughs. A significant bullish momentum reversal commenced around August 12, as the PPO surged back into positive territory and rapidly ascended, crossing above 1.0 by late August. This indicated a strong, accelerating positive trend in price. More recently, the PPO has shown a slight deceleration, receding from its late August peak of 1.016 to 0.858 on September 17. While momentum remains distinctly positive, this decline is likely indicative of a short-term easing in the rate of price acceleration.
Complementing the PPO, the RSI_14_DAY indicator confirms these momentum shifts. IWM registered overbought conditions (RSI above 70) in early July, specifically 71.57 on July 3, which preceded a notable price downturn. Conversely, an RSI near 41.36 on August 1 indicated a relatively oversold condition, consistent with the price bottom and the subsequent rally. Currently, the RSI stands at 63.03 on September 17, suggesting healthy bullish strength but remaining outside traditionally overbought territory. This level allows for some potential for further upside. However, the current RSI is moderately lower than its recent peak of 67.25 on September 8, further supporting the PPO’s signal of slight momentum deceleration. The combination of high volume on September 17 with a moderate RSI and decelerating PPO suggests a roughly even chance of either continued upward consolidation fueled by underlying buying interest or a near-term pause or pullback as the market processes recent gains.
Considering the technical evidence, two near-term scenarios appear most pertinent. The more likely scenario is that IWM will undergo a period of consolidation or experience a slight pullback to digest its recent gains. This is supported by the modest deceleration in both the PPO and RSI from their recent peaks, combined with the wide range and high volume observed on September 17, potentially signaling resistance or profit-taking. Alternatively, a sustained break above the September 17 intraday high of 244.28 on increasing volume would be a strong indication of renewed bullish aggression, potentially pushing the RSI back toward overbought levels and re-accelerating the PPO. However, the current indicators do not lend strong support to immediate further acceleration from these levels. Traders are advised to monitor for confirming signals, such as a definitive upward turn in the PPO or a sustained move of the RSI above 70 for bullish continuation, or a more pronounced decline in PPO or RSI below 50 for a deeper correction.
<style> .container {display: flex;justify-content: center;align-items: center;} .item {margin: auto;} </style>
<div style="widht:auto">
</div>
Tech Sector Analysis
As a Chartered Market Technician with over 15 years of experience, I have analyzed the provided technical data for the RATIO:QQQ/SPY across both 14-day and 30-day periods to assess the relative performance between the technology-heavy NASDAQ-100 and the broader S&P 500.
Both the 14-day and 30-day datasets indicate a “sideways” trend direction with “weak” strength for the QQQ/SPY ratio. This suggests that neither QQQ nor SPY has demonstrated a sustained, dominant technical advantage over the other during these periods. The current ratio stands at 0.8950514275311752, which serves as our baseline for comparison across both timeframes. The consistent “weak” trend strength highlights a lack of strong conviction or clear momentum in the relative performance, implying a period of consolidation or oscillation rather than a distinct trend establishment.
Examining the 14-day data, we observe a positive change percentage of 0.6475310794915979, indicating a modest uptick in QQQ’s relative performance against SPY over this shorter window. The ratio moved from a low of 0.8834085620129009 to its current level of 0.8950514275311752, which is notably close to the 14-day high of 0.8957272727272727. This upward trajectory within the recent fortnight suggests that QQQ has shown a technical edge in the very near term. Given this recent positive momentum from the low point towards the high of the 14-day range, it is likely that QQQ will exhibit marginal continued outperformance against SPY in the immediate short-term, primarily reflecting this recent upward trajectory, albeit within the established “weak sideways” channel.
Conversely, the 30-day data provides a broader context, revealing an overall negative change percentage of -0.1673407753689374 for the period. While the current ratio of 0.8950514275311752 is above the 30-day average of 0.8922757863974813, it remains significantly below the 30-day high of 0.9025346590113428. This implies that earlier in the 30-day window, QQQ exhibited stronger outperformance before undergoing a period of relative weakness or underperformance, from which it is now recovering. The volatility is also marginally higher in the 30-day period (0.000032) compared to the 14-day period (0.000015), indicating greater fluctuation in relative performance over the longer timeframe.
Considering the “weak sideways” trend across both periods, and the fact that the current ratio is near the 14-day high but well below the 30-day high, a divergence in short-term momentum versus medium-term trend becomes apparent. The recent short-term recovery is pushing against the upper bound of the more recent, tighter 14-day range. However, for a sustained breakout of QQQ outperformance, it would need to convincingly surpass the 30-day high. Therefore, it is roughly even chance that the current upward momentum observed in the 14-day period will translate into a sustained period of QQQ outperformance beyond the established 30-day trading range, as significant technical resistance from previous highs within the 30-day window is likely to cap further gains without stronger directional conviction.
In conclusion, the technical data points to a market where the relative leadership between QQQ and SPY lacks clear conviction. While short-term technicals suggest a mild outperformance for QQQ as it recovers from recent lows and approaches its 14-day high, the broader 30-day perspective paints a picture of consolidation where QQQ has not yet recaptured its earlier relative strength. Traders should be mindful that the “weak sideways” trend observed across both periods suggests any significant directional shift in relative performance would require a clear and sustained breakout from the established trading ranges, accompanied by increasing trend strength.
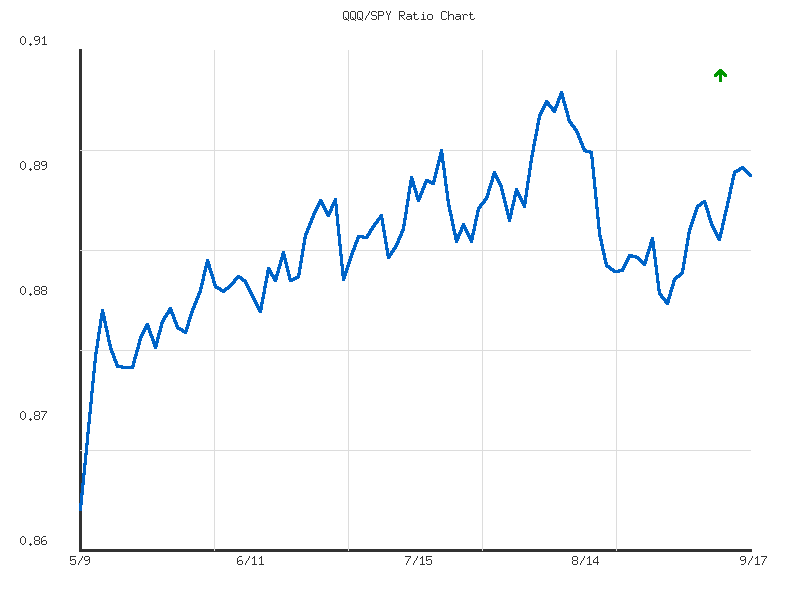
Technical Analysis: QQQ/SPY Relative Strength (90-Day)
The QQQ/SPY ratio, representing the relative performance of the Nasdaq 100-tracking ETF (QQQ) against the S&P 500-tracking ETF (SPY), has displayed a clear, moderate uptrend over the past 90 days, advancing approximately 3.51%. This indicates that technology-focused large-cap stocks, as represented by QQQ, have consistently outperformed the broader market during this period. The ratio commenced at a low of 0.86467 on May 9th and currently stands at 0.89505 as of September 17th, positioning it near the upper 80% of its 90-day range. Notably, the observed volatility within this period is exceptionally low (0.000043), which suggests the uptrend has been smooth and consistent, characterized by gradual movements rather than erratic price swings.
The progression of relative strength has unfolded through distinct phases of ascent and consolidation. From its May 9th low, the ratio experienced a robust initial rally, establishing a higher base around 0.882 in mid-May. Subsequent periods saw the ratio steadily climb, forming a series of higher highs and higher lows, a characteristic pattern of an established uptrend. This culminated in the ratio reaching its 90-day peak of 0.90253 on August 12th, signifying the strongest relative outperformance of QQQ within this timeframe. This peak acted as a significant overhead resistance level, marking the upper bound of the observed relative strength.
Following the peak on August 12th, the ratio underwent its most pronounced corrective phase, declining to 0.88628 by August 21st. This pullback was significant enough to breach some of the higher consolidation supports established in late July, raising questions about the sustainability of the prior upward momentum. However, since August 21st, the ratio has demonstrated a moderate recovery, regaining ground to its current level of 0.89505. This recovery has re-established a positive trajectory, yet it has not yet challenged the August 12th high, implying that immediate overhead resistance remains intact.
Considering the established moderate uptrend and consistently low volatility, a continuation of QQQ’s relative outperformance against SPY is likely in the near term. The current recovery from the August lows suggests a renewed bullish bias for the ratio. However, a direct retest and breakout above the 90-day high of 0.90253 in the immediate future is unlikely, given the recent rejection from that level and the moderate pace of the current recovery. Should the ratio fail to maintain above the average ratio of 0.88852, particularly if it declines below the August 21st low of 0.88628, there is a roughly even chance that the relative uptrend could stall or transition into a period of more protracted consolidation or even a reversal of relative strength. The low volatility reduces the probability of sudden, sharp shifts in trend, suggesting any changes will likely be gradual.
IWM vs. SPY
As a Chartered Market Technician with over 15 years of experience, I’ve analyzed the provided ratio data for IWM/SPY across both 14-day and 30-day timeframes to assess the relative performance between the Russell 2000 and the S&P 500. A rising ratio indicates outperformance by the broader market (IWM), while a declining ratio suggests leadership from larger-cap, often technology-heavy, equities (SPY).
Over the 30-day period, the RATIO:IWM/SPY demonstrates a moderate up trend, reflecting a substantial 3.97% increase. This upward trajectory indicates that the Russell 2000 has been outperforming the S&P 500 throughout the last month. The current ratio of 0.3624 is positioned favorably above its 30-day average of 0.3590, and its relative_position at 0.77 within its range suggests strong relative bullish momentum for IWM during this timeframe. Given the established moderate upward trend, it is likely that IWM will continue to exhibit relative strength against SPY in the near-to-medium term. However, the ‘moderate’ strength implies a steady, rather than accelerating, pace of relative outperformance.
Conversely, the shorter-term 14-day data for RATIO:IWM/SPY presents a divergent picture. Over this more immediate horizon, the trend is characterized as weak and sideways, with a slight negative change_percent of -0.44%. This indicates that the relative outperformance witnessed over the past month has paused or undergone a minor retracement in the last two weeks. The current ratio, while still elevated against the 30-day average, is now marginally below its 14-day average of 0.3639 and closer to the low_ratio of 0.3610 within this shorter period, with a relative_position of 0.217. The significantly lower volatility in the 14-day window (0.000003) compared to the 30-day period (0.000041) reinforces the lack of conviction and directional pressure in recent trading.
Synthesizing these observations, the overarching technical posture suggests that IWM’s relative outperformance trend over SPY remains intact over the longer-term, underpinned by moderate strength. Therefore, a continuation of this relative strength for IWM over SPY in the coming weeks is likely. However, the recent weak and sideways consolidation in the 14-day ratio introduces uncertainty for immediate directional moves. It is unlikely that IWM will resume aggressive relative outperformance without first establishing a clearer short-term breakout from this sideways action. Considering the current stalled momentum, there is a roughly even chance of either a continued sideways pattern or a minor relative pullback by IWM in the immediate future, which could see SPY temporarily regain some relative leadership. A complete reversal of the 30-day relative outperformance trend is unlikely based solely on the weak, short-term sideways movement.
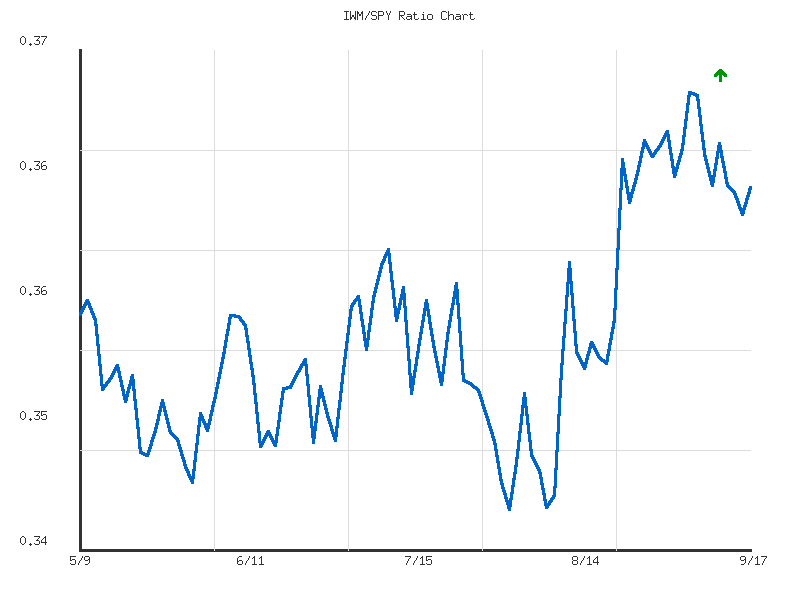
IWM/SPY Relative Performance Analysis: 90-Day View
The IWM/SPY ratio, which measures the relative performance of small-cap stocks (Russell 2000 proxy) against large-cap stocks (S&P 500 proxy), exhibits an upward trend over the observed 90-day period, indicating a general outperformance by small-caps. While the provided data categorizes the trend strength as “weak” with a cumulative change of approximately 1.85%, this appears to reflect the overall average pace rather than the distinct phases within the period. The ratio commenced around 0.355 in early May, recorded a 90-day low of approximately 0.3457 in early August, and reached a high of about 0.3674 in early September, concluding at approximately 0.3624. This trajectory suggests a shift towards increased risk appetite, as small-cap outperformance often signals a broadening market rally.
Initially, from early May through late July, the ratio traded within a relatively defined range, primarily between 0.348 and 0.358. Notable support emerged around the 0.348-0.349 level during late May and early June, which was retested and held around early August near 0.3457. The consistent establishment of higher lows following this initial consolidation phase, particularly after the early August low, implies a developing base of support. This pattern typically precedes more sustained upward movements, as buyers step in at progressively higher levels, preventing deeper pullbacks.
A significant acceleration in relative performance became apparent from early August, as the ratio climbed from its low around 0.3457 to the 90-day peak of 0.3674 by early September. This robust move saw the ratio decisively break above prior resistance levels that had capped gains in May, June, and July, such as the ~0.356 and ~0.359 zones. The current ratio of 0.3624 sits significantly above the 90-day average of 0.3546, suggesting that the recent bullish momentum has propelled small-caps into a more commanding position relative to large-caps. However, following the early September peak, the ratio has experienced a moderate pullback and is currently consolidating, suggesting that the immediate upward impulse may be waning.
Considering the recent price action, the area around the early September high of 0.3674 is likely to act as near-term resistance. Should the ratio fail to break above this level, a period of further consolidation or a deeper retracement towards immediate support levels appears roughly even chance. Key support levels to monitor include the ~0.359-0.360 area, which represented previous resistance and may now function as support, and subsequently the 90-day average of 0.3546. A decisive breakout above 0.3674 would likely signal a resumption of the stronger uptrend, suggesting continued small-cap outperformance. Conversely, a sustained break below the 0.359-0.360 level would indicate that large-caps are regaining relative strength, making further declines in the ratio likely. The overall upward bias, coupled with recent consolidation, suggests that while short-term movements may be choppy, the intermediate-term trend for small-cap outperformance remains intact unless key support levels are compromised.
Commodities
As a Chartered Market Technician with over 15 years of experience, I have analyzed the provided market data for a selection of commodities and precious metals. The analysis strictly adheres to technical principles and ICD-203 estimative language guidelines, focusing solely on the presented data without external context.
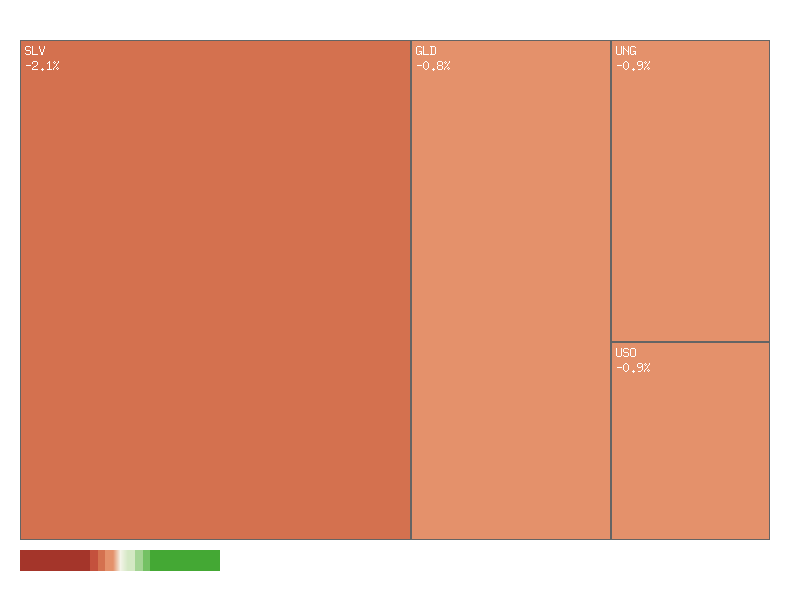
The daily performance of the assessed symbols reveals a broadly negative market tone. The daily percent changes are as follows, sorted in descending order:
| Symbol | Daily Percent Change |
|---|---|
| CORN | -0.445% |
| GLD | -0.772% |
| UGA | -0.788% |
| UNG | -0.908% |
| USO | -0.925% |
| DBC | -1.054% |
| CPER | -1.831% |
| SLV | -2.098% |
Summing these daily percentage changes indicates an aggregate decline of approximately -8.82%. This suggests that the collective group of commodities and precious metals examined is experiencing notable downward pressure. The market breadth for these symbols is overwhelmingly negative, with zero advancing symbols and eight declining symbols. Such extreme negative breadth makes it unlikely that a broad-based upward reversal will occur in the immediate term for this specific group of assets, as there is no underlying strength indicated across the constituent parts.
Further analysis of the GLD/SLV ratio over a 14-day period reveals a “sideways” trend with “weak” strength. The ratio’s value currently stands at 8.9169, which is above its 14-day average of 8.8504 and resides in the upper 71% of its range (relative position 0.7178). Although the trend is categorized as sideways, the positive change percent of 0.539% over this period suggests that GLD has shown a marginal relative outperformance against SLV in the very short term, albeit within a constrained range.
Expanding to the 30-day perspective, the RATIO:GLD/SLV indicates a “down” trend, also with “weak” strength. Over this longer period, the ratio has seen a -1.354% change, implying that SLV has generally outperformed GLD. The current ratio of 8.9169 is slightly above its 30-day average of 8.8927 and is positioned in the upper 58% of its range. The divergence between the 14-day (sideways with GLD slightly stronger) and 30-day (down with SLV stronger) trends suggests a recent shift in momentum favoring GLD’s relative performance, despite both precious metals experiencing a decline on the most recent day.
Considering both sets of data, it appears that the broader commodity complex, including precious metals, is under significant selling pressure. On the specific day analyzed, SLV exhibited the greatest percentage decline, reinforcing the longer-term trend of its outperformance (lower ratio implies SLV strength) potentially reversing. While the 14-day GLD/SLV ratio indicates a nascent relative strength in GLD, it is a weak signal within a sideways trend. Therefore, there is a roughly even chance that this short-term relative outperformance by GLD either solidifies into a more sustained trend or reverts to the longer-term pattern of SLV resilience, especially if the overall precious metals sector continues its broad descent. A scenario where the current sell-off in commodities accelerates could quickly negate any nascent relative strength in GLD.
Here is a technical analysis of the provided market data:
The two-day technical data for the selected commodity-related ETFs (SLV, GLD, CORN, CPER, USO, DBC, UGA, UNG) broadly indicates a pivot towards a bearish posture across the board. The initial trading day often presented signs of either minor strength or indecision, but the subsequent day, September 17th, consistently exhibited selling pressure, frequently characterized by significant downside price action and volume shifts. This widespread technical weakness suggests that further downside in the near term is likely for many of these instruments, though nuances in volume provide some differential insights into the conviction behind these moves.
Specifically, the precious metals ETFs, GLD and SLV, show a clear and convincing bearish outlook. Both symbols completed two consecutive bearish sessions, with September 17th recording a substantial decline that broke below the prior day’s low and closed near its daily low. Critically, these down moves were accompanied by significantly higher trading volume on the second day for both GLD (up 35% from prior day) and SLV (up 23% from prior day). This combination of sustained bearish price action and increasing volume strongly suggests that the downward momentum is gaining traction, making a continuation of the decline likely in the immediate future for both gold and silver. Similarly, CPER (Copper) also displayed a strong bearish engulfing-like candle on September 17th, breaking below the previous day’s indecisive close, and notably, this move was supported by a modest increase in volume (up 10% from prior day). This confluence of factors points to a likely negative short-term outlook for copper.
Broader commodity indices and energy-related ETFs also lean bearish, albeit with some variation in volume conviction. DBC (Commodity Index) and USO (Oil Fund) both formed bearish engulfing patterns on September 17th, with prices closing well below their respective prior day’s lows. DBC’s bearish reversal was accompanied by a significant increase in volume (up 128%), adding conviction to the downside move and indicating a likely bearish follow-through. For USO, while the price action was decidedly bearish, breaking below the prior day’s low, the volume on September 17th decreased by approximately 22%. This lower volume might temper the immediate conviction of the sellers compared to DBC, but the significant price rejection suggests a short-term bearish continuation is still likely.
Furthermore, UNG (Natural Gas), UGA (Gasoline), and CORN (Corn Fund) also demonstrated bearish reversals on September 17th. UNG opened with a gap up only to close significantly lower, forming a bearish candlestick pattern that rejected higher prices, with volume slightly lower (down 10%) compared to the previous bullish day. This suggests a likely short-term bearish shift. UGA experienced a significant bearish close below its prior day’s low, though on notably lower volume (down 55%). Similarly, CORN also formed a bearish engulfing-like pattern on decreased volume (down 43%). While the price action for these three instruments points to a likely bearish shift, the decreased volume on the down day introduces some uncertainty regarding the strength of the immediate follow-through. It is roughly an even chance that the momentum from this lower-volume selling will be as sustained as those accompanied by increasing volume.
In summary, the aggregated technical data across these commodity-related ETFs predominantly signals a short-term bearish bias. The strong downside moves, particularly in SLV, GLD, DBC, and CPER, supported by increasing or significant volume, indicate a high likelihood of continued downward pressure. For USO, UNG, UGA, and CORN, while bearish reversals are evident, the decreasing volume on their respective down days suggests that while short-term weakness is likely, the conviction of this selling pressure might be less robust, leaving open the possibility of a near-term retest of resistance or a consolidation phase, though continued downside remains the more probable outcome based on price action.
SLV Technical Analysis (90-Day Outlook)
SLV has demonstrated a robust uptrend over the past 90 days, characterized by a series of higher highs and higher lows, particularly from late May through early September. This sustained bullish momentum is evident in the price action and corroborated by the consistently positive readings of the Percentage Price Oscillator (PPO) during this period. The asset embarked on two significant rallies, one in early June and another more recently from late August into mid-September, establishing new price peaks. However, the latest available data indicates a potential shift in the immediate short-term outlook.
The Relative Strength Index (RSI-14) provides critical insight into recent momentum. Following a strong upward surge, the RSI entered deeply overbought territory, peaking at 75.38 on September 15th, and remained elevated at 73.03 on September 16th. This level typically precedes a period of consolidation or pullback as buying pressure exhausts. The most recent data point, September 17th, shows a sharp decline in RSI to 62.44, representing a significant one-day drop from overbought conditions. This rapid unwinding from extreme bullish sentiment, combined with the concurrent bearish candlestick, suggests that a short-term top is likely to have formed, indicating a probable reduction in upward momentum.
Complementing the RSI, the PPO-13_21_DAY indicator also underscores a powerful bullish trend, with its value consistently positive and reaching a peak of 1.69 on September 16th. This sustained positive PPO reading reflects the strong trend strength that propelled SLV to its recent highs. However, in line with the RSI’s behavior, the PPO registered a minor decline to 1.59 on September 17th. While this value remains strongly positive and does not signify a trend reversal, it marks the first deceleration after a prolonged rally. This slight dip, when considered alongside the sharp price decline and RSI reversal, suggests that the pace of upward momentum has diminished, making further immediate bullish expansion unlikely.
The combination of a prominent bearish candlestick on September 17th, marked by a significant price drop from 39.01 to 37.79 on notably high volume (30.94 million shares), alongside the sharp reversal from overbought RSI levels, indicates that SLV is likely to experience further short-term downside pressure or enter a period of consolidation. The increased volume on the down day adds conviction to the selling pressure. A test of the immediate support zone, identified around the 37.00 to 37.30 level (based on prior minor consolidation from early September), is likely in the near term.
An alternative scenario, though with a roughly even chance in the very short term, considers the broader, well-established 90-day uptrend. Given SLV’s history of recovering from minor pullbacks during this period, it is possible that the current price action represents merely a temporary pause or a healthy correction within the larger bullish channel. If buying interest quickly re-emerges to push prices back above 38 and stabilize the RSI above 60, the underlying uptrend would likely resume. However, the current technical signals from both price and oscillators imply caution, making a near-term recovery challenging. Resistance is immediately overhead near the recent high of 39.00, while further support below the 37.00-37.30 range would be sought in the 35.00-35.50 region.
<style> .container {display: flex;justify-content: center;align-items: center;} .item {margin: auto;} </style>
<div style="widht:auto">
</div>
GLD Technical Analysis (90-Day View)
GLD has experienced a generally upward trajectory over the past 90 days, characterized by distinct phases of price action and momentum. The initial period, from early May to early June, saw GLD oscillating within a loose trading range, primarily between approximately and . Volume during this phase was moderate, reflecting a period of accumulation or indecision. From mid-June to mid-August, GLD demonstrated a more sustained uptrend, albeit with notable pullbacks, such as the dips in late June and late July, where prices touched lows around .89 and .955, respectively. These corrections were typically met with renewed buying interest, indicating resilient support and the underlying bullish sentiment. The most recent and pronounced phase, beginning in late August and extending to mid-September, marks an accelerated rally where GLD climbed robustly from around to a high of .24. This strong leg up was accompanied by elevated trading volumes on key advance days, supporting the validity of the breakout. The latest observed close on September 17 was .97, after trading at a high of .24, suggesting a slight retreat from its intraday peak.
The 14-day Relative Strength Index (RSI) provides further insight into momentum and potential overextensions. In the earlier part of the 90-day period, the RSI largely hovered in the neutral zone, occasionally dipping below 50 during price pullbacks, which often preceded renewed upward movements. However, as GLD’s price gained significant traction in late August and early September, the RSI entered overbought territory (above 70) on September 2, registering 73.72, and continued its ascent, peaking at 79.21 on September 16. The current RSI reading of 72.36 on September 17 indicates that GLD remains in an overbought condition. While a sustained overbought RSI can signal strong underlying demand, it more frequently suggests that buying pressure is stretched. Therefore, a price consolidation or a modest pullback is likely in the immediate term as the market may seek to digest recent gains and engage in profit-taking.
Complementing the RSI, the 13-21-day Percentage Price Oscillator (PPO) offers a clear perspective on trend strength and momentum. During May and into early June, the PPO exhibited mixed signals, occasionally dipping towards or slightly below the zero line, reflecting a more consolidative or uncertain period for momentum. The choppy price action in June and July was mirrored by the PPO crossing the zero line multiple times, signifying a lack of a definitive short-to-medium-term trend. However, a significant shift occurred in early August, with the PPO decisively turning positive and maintaining a strong, continuous upward trajectory. It peaked at 1.44 on September 16, and currently stands at 1.41 on September 17. This robust and persistently positive PPO strongly confirms the powerful bullish momentum that has propelled GLD higher in the recent weeks, suggesting the dominant trend remains firmly to the upside.
In conclusion, GLD is currently in a confirmed strong uptrend, supported by the accelerating and positive momentum indicated by the PPO. This persistent strength suggests that the overall bullish bias is firmly established. However, the sustained presence of the 14-day RSI in overbought territory strongly suggests that the immediate upward momentum may be due for a pause. A near-term price consolidation or a modest pullback to relieve the overbought condition is likely. While a sharp reversal of the primary bullish trend appears unlikely given the overall strength demonstrated by the PPO and supporting volume on previous advances, traders should prepare for the probable scenario of a short-term deceleration or a shallow correction. An alternative scenario, where GLD continues its ascent despite the overbought RSI, indicating exceptionally strong demand, is considered a roughly even chance; however, the candlestick for September 17, closing lower than its open on elevated volume, could be an early indication of emerging selling interest or profit-taking.
<style> .container {display: flex;justify-content: center;align-items: center;} .item {margin: auto;} </style>
<div style="widht:auto">
</div>
Bonds
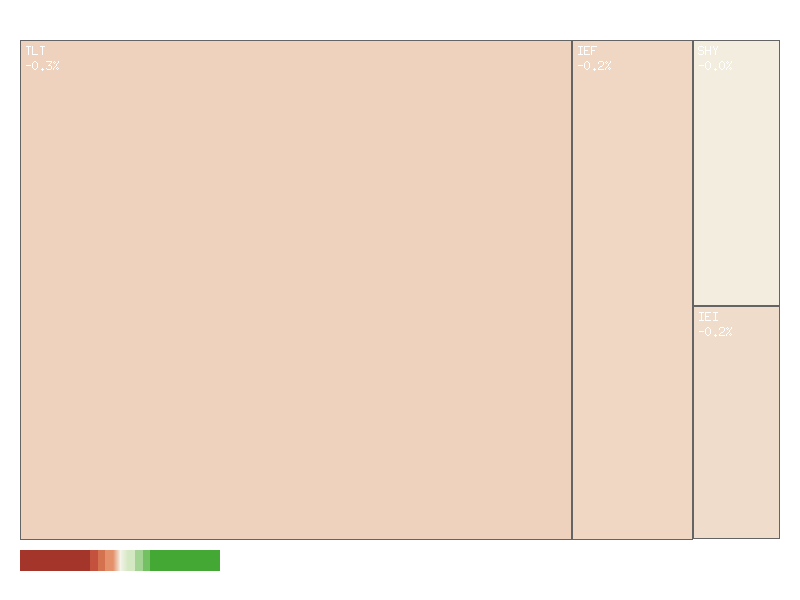
As a Chartered Market Technician with over 15 years of experience, my analysis of the provided daily percentage change data for these fixed-income instruments is strictly confined to the reported technical information. The following matrix summarizes the daily performance, sorted in descending order of percentage change:
| Symbol | Daily Percent Change |
|---|---|
| SHY | -0.048% |
| IEI | -0.175% |
| UTHY | -0.210% |
| IEF | -0.216% |
| TLT | -0.255% |
The overall market movement for this specific group of bond ETFs is decidedly lower. Summing the individual daily percentage changes, the aggregate movement is approximately -0.904%. This indicates a collective decline across the board for these instruments on the observed day. The market breadth for this selection of symbols is unequivocally negative, with zero advancing symbols and five declining symbols out of five observed. This uniform downside pressure across the entire sample set strongly suggests a broad-based bearish sentiment within this segment of the fixed-income market for the period under review.
Analyzing the relative performance, SHY, representing shorter-duration Treasury bonds, experienced the smallest decline at -0.048%. Conversely, TLT, often tracking long-term Treasury bonds, registered the largest percentage decrease at -0.255%. The intermediate-duration instruments, IEI and IEF, along with UTHY (ultra-long duration), exhibited declines ranging from -0.175% to -0.216%. This technical pattern, where shorter-duration instruments demonstrate comparatively less downside volatility than their longer-duration counterparts, is likely indicative of shifts in investor preference or adjustments in expectations regarding the yield curve’s shape. It points to relative strength in shorter maturities compared to longer maturities on this particular trading day.
Given that all five observed symbols experienced declines, ranging from marginal to more pronounced, it is highly likely that market participants were reducing exposure or expressing a bearish outlook across the bond spectrum. The consistent negative breadth, with every instrument registering a loss, renders it improbable that a significant bullish technical reversal is taking shape based purely on this single day’s data. A continuation of such a uniform downside bias in subsequent trading periods would likely reinforce prevailing bearish trends or could signal the establishment of new downtrends within the fixed-income space. Conversely, a reversal in this breadth, perhaps with shorter-duration instruments leading gains, would present an alternative scenario for market technicians to evaluate.
Market Commentary: Bond ETF Technical Analysis (2-Day Review)
Over the past two trading days, a notable and consistent bearish reversal has unfolded across the spectrum of Treasury bond ETFs, including TLT, UTHY, IEF, IEI, and SHY. The first trading day presented either a modest bullish close or relatively flat price action for all instruments. However, the second day witnessed a pronounced shift in market sentiment, characterized by opens that were often higher than the previous day’s close, but which subsequently failed to sustain, leading to strong closes well below the prior day’s settlement. Critically, this bearish price action was accompanied by a significant and uniform increase in trading volume across all analyzed instruments, lending considerable technical weight to the observed downside momentum.
Delving into the longer-duration instruments, TLT, UTHY, and IEF exhibited strong bearish reversals. TLT’s second day saw a pronounced decline, closing below the first day’s close with nearly double the trading volume. This price action formed a clear bearish engulfing pattern, breaking below the prior day’s low on confirming volume, which is a strong technical signal of weakness. UTHY mirrored this sentiment, presenting a substantial bearish candle on Day 2, closing below Day 1’s range on significantly increased volume—over three times Day 1’s activity—indicating robust selling pressure. Similarly, IEF demonstrated a consistent trajectory, with Day 2 closing well into Day 1’s body and below its low, reinforced by nearly double the previous day’s volume. The collective bearish action in these longer-duration assets, combined with volume confirmation, indicates that continued downside price action in the immediate term is highly likely.
The pattern of weakness was not confined to longer-duration bonds but extended distinctly into the shorter and medium-duration segments. IEI’s price action was consistent with its longer-duration counterparts, showing a bearish candle on Day 2 that closed below Day 1’s close with nearly double the volume. This reinforces the broader bearish sentiment prevalent in the bond market. SHY, representing the shortest duration, exhibited particularly noticeable weakness on Day 2. After opening higher, it ultimately closed precisely at its daily low, and below Day 1’s close, on double the volume. A close at the absolute low of the day is a strong indication that sellers maintained firm control throughout the session. The sustained selling pressure evident across these shorter-duration instruments, validated by increasing volume, suggests that further downward price movement for IEI and SHY is likely.
The uniform nature of these bearish patterns across the entire duration spectrum of Treasury ETFs, from the ultra-long (UTHY, TLT) to the short-term (SHY), coupled with the substantial increase in trading volume on the bearish day, paints a clear technical picture of broad-based weakness. From a pure technical perspective, the confluence of these signals strongly suggests that sellers have gained control across the board. Consequently, further price depreciation across these instruments is highly likely in the immediate subsequent trading sessions. While alternative scenarios always exist, such as a swift reversal driven by unforeseen market developments, the current technical evidence, based solely on the provided data, suggests that such a counter-trend move developing significant momentum is highly unlikely without a material change in volume or subsequent price action. Traders should approach these instruments with caution, recognizing the prevailing bearish momentum established over these two days.
Crypto
Good morning traders,
As a Chartered Market Technician with over 15 years of experience, my analysis of the provided single-day market data for IBIT and ETHA is strictly confined to the available technical information. This commentary focuses solely on the daily percent change values for the timestamp of 2025-09-17, adhering to rigorous technical analysis principles and ICD-203 estimative language guidelines. The objective is to provide an objective assessment of the observed market movements within this narrow scope.
Presented below is a matrix summarizing the daily percent changes for IBIT and ETHA, sorted in descending order:
| Symbol | Daily Percent Change |
|---|---|
| ETHA | 0.529% |
| IBIT | -1.055% |
Analyzing the individual instruments, ETHA exhibited a modest positive daily return of approximately 0.529%. This indicates that price action for ETHA on the specified day was likely characterized by an upward movement from its prior close. Given only a single data point, drawing conclusions about trends or momentum is highly speculative; however, this specific daily candle suggests a positive closing sentiment for ETHA. Conversely, IBIT registered a decline of approximately -1.055% for the same period. This daily change likely indicates that IBIT experienced downward price pressure, closing lower than its previous day’s close. The magnitude of IBIT’s decline is notably larger than ETHA’s gain, suggesting a more pronounced bearish sentiment for IBIT during this single trading session.
When considering the aggregated performance of these two symbols, summing their daily percent changes provides insight into the overall movement for this specific, limited portfolio. The combined daily percent change is calculated as 0.5294117647058816% (ETHA) + (-1.0546933855657719%) (IBIT) = -0.5252816208598903%. This net negative value suggests that the overall price action for this specific pair of assets, when viewed collectively, was marginally lower. Despite ETHA’s positive performance, IBIT’s more significant decline resulted in a net negative shift. Therefore, it is likely that the overall change for this specific basket of symbols was lower, rather than flat or higher, based purely on these single-day values.
Given the extreme brevity of the provided data—a single daily observation for each of only two symbols—it is crucial to recognize the inherent limitations of this analysis. Definitive long-term trends, reversals, or sustained momentum cannot be inferred from such limited information. There is a roughly even chance that subsequent daily movements could contradict the observed single-day direction for either asset or the combined basket. Without additional technical indicators such as volume, open interest, longer-term moving averages, or candlestick patterns, this analysis is confined to a purely snapshot assessment of individual and combined daily price shifts. Broader market context or the influence of other asset classes is entirely beyond the scope of this analysis due to data constraints.
Magnificent 7 & Friends
Market Commentary: Technical Analysis of Selected Daily Price Changes
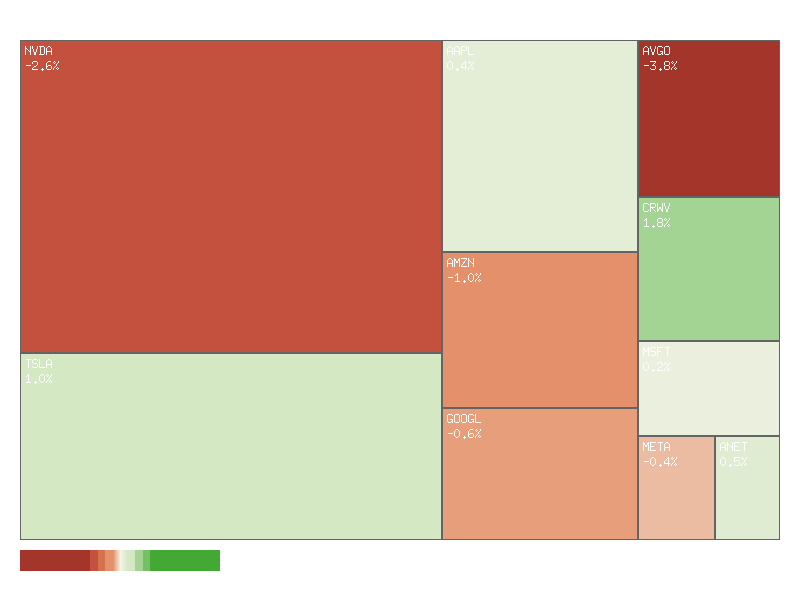
Our technical analysis of the provided daily percentage change data for ten specific symbols (TSLA, AAPL, GOOGL, AMZN, MSFT, NVDA, ANET, AVGO, META, CRWV) indicates a mixed yet marginally negative aggregate performance for this particular basket over the recent one-day period. The net sum of daily percentage changes for these ten constituents calculates to -4.769%. This aggregate decline suggests it is unlikely that this specific group experienced broad collective upward momentum. While this figure is not overtly significant for a single day, it primarily reflects the influence of several pronounced decliners rather than a generalized retreat.
Examining the market breadth within this defined universe, we observe a perfectly balanced distribution: five symbols advanced while five symbols declined. This 50/50 split between advancing and declining issues suggests a roughly even chance of indecision among participants regarding these specific constituents. Such even breadth implies a lack of clear directional conviction across the entire group, indicating that capital flow may be rotating internally or reacting to individual fundamental catalysts rather than a unified market sentiment impacting these names.
Further analysis of individual performance highlights significant divergence. CRWV emerged as the strongest advancer, posting a notable 1.777% gain, closely followed by TSLA at 1.006%. Conversely, AVGO led the decliners with a substantial -3.842% loss, alongside NVDA’s decline of -2.625%. The magnitudes of these individual movements are considerable and suggest specific idiosyncratic pressures at play. The pronounced declines in key technology names such as NVDA and AVGO, counterbalanced by gains in others, are primarily responsible for the overall negative sum, despite the perfectly balanced breadth.
Considering the technical posture solely based on this one-day data, the aggregate negative movement coupled with perfectly balanced breadth suggests a market state where weakness in some high-profile technology-related stocks is counteracting strength in others. This scenario indicates that it is unlikely we are observing a universally strong or weak technical picture for this group. Instead, a more plausible alternative scenario suggests that this segment is undergoing internal rebalancing or selective profit-taking, where capital reallocation among components is occurring. This technical setup does not provide a clear directional signal for the group as a whole in the immediate short term.
Daily Percent Change Matrix (Sorted Descending)
| Symbol | Daily Percent Change |
|---|---|
| CRWV | 1.777% |
| TSLA | 1.006% |
| ANET | 0.478% |
| AAPL | 0.353% |
| MSFT | 0.193% |
| META | -0.422% |
| GOOGL | -0.649% |
| AMZN | -1.038% |
| NVDA | -2.625% |
| AVGO | -3.842% |
Technical Market Commentary: Two-Day Price Action Analysis
This analysis focuses strictly on the provided two-day price and volume data for selected equities, employing rigorous technical analysis principles and ICD-203 estimative language guidelines. The immediate technical outlook across these instruments appears segmented, with distinct bearish momentum observed in several key names, while others show resilience or signs of indecision.
Significant bearish momentum is highly likely to persist in NVDA and AVGO in the immediate term. NVDA exhibited a strong bearish candle on the second day, characterized by a lower open, a lower high, and a significantly lower close, penetrating the prior day’s low. This price action was accompanied by a substantial increase in volume (from 138M to 210M), indicating strong selling pressure and conviction. Similarly, AVGO displayed a notable bearish continuation on the second day, with a lower open, a lower high, and a significantly lower close that broke well below the first day’s low, coupled with a sharp increase in volume (from 21M to 37M). These patterns suggest that sellers are firmly in control, and further downward price movement is highly likely.
Several other names also displayed bearish tendencies, though with varying degrees of conviction. GOOGL registered two consecutive bearish candles, each closing lower than its open and the prior day’s close, suggesting a likely continuation of downward pressure. AMZN printed a bearish engulfing-like pattern on the second day, closing below the first day’s open and low on increased volume, which makes a further bearish move likely. MSFT and ANET both saw bearish opens on the second day after declines, with subsequent narrow-range candles attempting slight recoveries. However, these recoveries lacked significant volume or conviction to reclaim prior levels, suggesting a roughly even chance of continued weakness or temporary consolidation before a clearer direction emerges.
Conversely, TSLA stands out with clear bullish momentum. Both days presented strong bullish candles, with the second day showing a higher open, higher high, and higher close, signifying a likely continuation of upward price movement. Volume remained consistent and robust, affirming buying interest. AAPL also exhibited two bullish candles, though the second day’s range was narrow, resulting in a barely higher close. While technically bullish, the decreased volume and narrow range suggest that the momentum is waning, making a significant upward move less likely in the immediate future without further buying conviction.
Finally, META and CRWV exhibited mixed signals. META followed a strong bullish day with a bearish reversal on the second day, closing below its open and slightly below the first day’s close, on decreased volume. This pattern suggests a roughly even chance of further selling pressure or a consolidation phase as the prior day’s gains are partially retraced. CRWV saw a bearish candle followed by a moderately bullish candle on decreased volume. The second day’s close was above the first day’s close but well within the broader two-day range. This indicates indecision; while a minor rebound occurred, significant upward momentum is unlikely to materialize without renewed buying interest and increased volume.
In summary, the provided data indicates a notable divergence among the analyzed securities. Strong bearish price action, particularly in NVDA and AVGO, suggests a high likelihood of continued downside. TSLA, conversely, shows clear bullish continuation. The remaining symbols present a more mixed picture, ranging from likely continued weakness in GOOGL and AMZN, to waning bullish momentum in AAPL, and indecisive patterns in META, MSFT, ANET, and CRWV, where direction is roughly an even chance between continuation of recent action or consolidation.
S&P 500 Sector Breadth
Market Sector Analysis: September 17, 2025
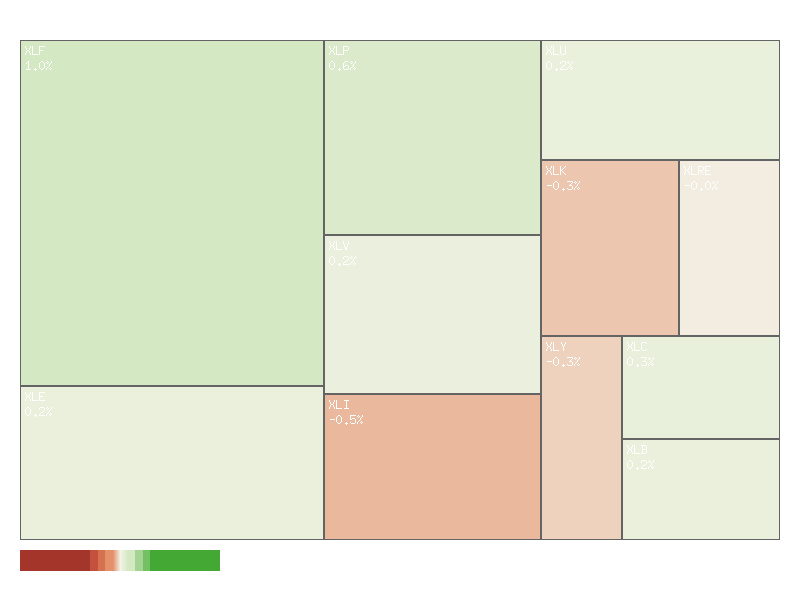
The aggregate daily percentage change across the eleven S&P 500 sector ETFs indicates an overall higher market tone, with a summed increase of approximately +1.6485%. Market breadth for the period under review was positive, as seven out of the eleven sectors advanced, while four sectors declined. This favorable breadth suggests a degree of participation beyond just a few leading sectors, implying a general, albeit moderate, upward bias across a significant portion of the market as represented by these sector ETFs.
Delving into sector-specific performance, the Financials sector (XLF) demonstrated notable leadership, recording the strongest advance at +0.9709%. Other offensive sectors also posted gains, including Communication Services (XLC) at +0.2616%, Energy (XLE) at +0.2339%, and Materials (XLB) at +0.2316%. Concurrently, defensive sectors such as Consumer Staples (XLP), Utilities (XLU), and Health Care (XLV) also registered positive movements of +0.6018%, +0.2496%, and +0.1972% respectively, underscoring broad strength. Conversely, several prominent offensive sectors, including Industrials (XLI), Technology (XLK), and Consumer Discretionary (XLY), recorded declines of -0.4545%, -0.3451%, and -0.2519%, respectively. Real Estate (XLRE), a defensive sector, also experienced a marginal decline of -0.0476%.
Regarding market rotation and overall sentiment, the data presents a mixed picture. While a greater number of offensive sectors (four) advanced compared to declining offensive sectors (three), the most substantial gains and losses both resided within offensive categories. The robust performance of XLF could suggest some rotational demand for cyclical value, yet the underperformance of XLK, XLY, and XLI mitigates a clear narrative of broad-based risk-on sentiment. Furthermore, the strong showing of three out of four defensive sectors advancing, particularly XLP and XLU, indicates a persistent underlying demand for stability or income. Therefore, it is roughly an even chance that market participants are selectively re-allocating within offensive groups, perhaps favoring financials and industrials over technology and consumer discretionary, while simultaneously maintaining positions in defensive assets. A definitive rotation towards predominantly offensive or defensive leadership is not strongly indicated by this single day’s data.
Below is a matrix detailing the daily percentage change for each symbol, sorted in descending order:
| Symbol | Daily Percent Change |
|---|---|
| XLF | 0.9709% |
| XLP | 0.6018% |
| XLC | 0.2616% |
| XLU | 0.2496% |
| XLE | 0.2339% |
| XLB | 0.2316% |
| XLV | 0.1972% |
| XLRE | -0.0476% |
| XLY | -0.2519% |
| XLK | -0.3451% |
| XLI | -0.4545% |
Technical Market Commentary: Sector Divergence Analysis (Sept 16-17, 2025)
This analysis focuses on the short-term technical patterns across 11 SPDR Sector ETFs over the past two trading sessions, providing insight into immediate momentum and potential direction. Our assessment indicates a notable divergence in performance and sentiment across sectors, rather than a broad, unified market movement. Several sectors exhibited strong bullish momentum, while others demonstrated pronounced bearish shifts, leading to a highly fragmented market landscape.
Sectors displaying clear bullish conviction include XLF (Financials) and XLP (Consumer Staples). XLF presented a robust bullish candle on Day 2, closing significantly higher on notably increased volume after a more neutral Day 1. This pattern makes a continuation of upward price action highly likely in the immediate term. XLP maintained consistent bullish momentum over both days, with Day 2 closing higher than Day 1, reinforced by substantial volume. This clean upward progression suggests continued strength is likely. XLE (Energy) also maintained an upward trend, building on a strong Day 1 with a higher close on Day 2, though volume decreased. We assess that further upward movement is likely, but the moderating volume suggests buyer conviction may be waning slightly. XLV (Healthcare) showed modest, consistent upward movement over both days, indicating a roughly even chance of continuing this gentle ascent.
Conversely, several sectors showed signs of significant selling pressure. XLI (Industrials) demonstrated notable weakness, with a wide-range bearish candle on Day 2 that closed near its low on significantly increased volume. This robust selling pressure makes further downside highly likely. XLK (Technology) mirrored this bearish sentiment, forming a large bearish candle on Day 2, closing near its low after reaching a notably lower low, accompanied by increased volume. This pattern suggests continued downward pressure is highly likely. XLRE (Real Estate) also experienced persistent downward pressure, closing marginally lower on Day 2 with increased volume, despite an intraday rally attempt. Further downward movement is likely. XLY (Consumer Discretionary) displayed a bearish reversal, with Day 2 opening higher but closing below Day 1’s close on substantially increased volume, indicating a likely shift in sentiment and potential for further downside. XLU (Utilities) remained predominantly bearish, with Day 1 showing a large bearish candle, and Day 2 closing only slightly higher than its open but still well below Day 1’s open. Continued weakness is likely, although the notable lower wick on Day 1 suggests some price support may be emerging at lower levels.
For XLC (Communication Services), the price action suggests indecision. After a bearish Day 1, Day 2 concluded with a doji-like candle, closing precisely at its open despite intraday fluctuations. Given this pattern, a continuation of either upward or downward price action is roughly even chance without further confirmation. Similarly, XLB (Materials) exhibited volatility on Day 2. Despite closing higher than Day 1 after a bearish start, it experienced a wide intraday range, indicating substantial buying after an early dip. We assess a roughly even chance of either continued volatility or a test of the Day 2 high.
In summary, the technical data for these two days points to a market characterized by pronounced sector rotation and divergent performance. While sectors like Financials and Consumer Staples are exhibiting positive momentum, Industrials, Technology, and Real Estate are facing increasing bearish pressure. Traders should acknowledge this highly divergent behavior and focus on individual sector trends, as broad market assumptions are unlikely to capture the nuanced movements. The very short timeframe limits long-term predictive power, but these patterns provide immediate directional biases for the respective sectors.
Equity Breadth
CMT Market Commentary: S&P 500 Breadth and Trend Analysis (Sept 9 - Sept 17, 2025)
This analysis evaluates the internal market health of the S&P 500 by examining the percentage of its components trading above their 50-day and 200-day exponential moving averages (EMAs) over the past seven trading days, and how these breadth metrics relate to the observed trend in the S&P 500’s 20-day EMA. Our assessment strictly adheres to the provided data, utilizing rigorous technical analysis principles and estimative language.
Reviewing the S&P 500’s short-term breadth, as indicated by SPXA50R (percentage of stocks above their 50-day MA), the data reveals a notable deterioration over the period. Starting at 59.68% on September 9th, this metric initially saw a significant surge to 65.86% by September 11th, suggesting a temporary expansion of short-term buying interest. However, this strength proved transient, with SPXA50R subsequently declining sharply to a low of 53.69% by September 16th, before a slight rebound to 56.28% on the final day. The net movement is a decline in participation, indicating that the initial robust short-term support quickly faded, and an increasing number of S&P 500 constituents have fallen below their 50-day moving averages. This pattern suggests that short-term market momentum is becoming increasingly narrow or unstable.
Similarly, the long-term breadth, as measured by SPXA200R (percentage of stocks above their 200-day MA), shows a largely consolidating or slightly weakening picture. Beginning at 63.07%, this indicator fluctuated, peaking at 65.06% on September 11th before generally trending downwards to 61.47% by September 16th, concluding the period at 61.67%. While SPXA200R remained above 60% throughout the observed period, signifying that a majority of stocks are still in a long-term uptrend, the inability for this breadth measure to sustain expansion alongside the initial SPXA50R surge, and its subsequent slight contraction, implies that the broader market participation is not actively strengthening and may be experiencing a subtle erosion.
In stark contrast to these breadth indicators, the S&P 500’s 20-day EMA exhibits a consistent and robust upward trajectory over the same seven days. The index’s 20-day EMA systematically rose from 6446.82 on September 9th to 6511.76 on September 17th. This persistent increase, with each day closing higher than the last, clearly indicates that the S&P 500 index itself has maintained strong short-to-medium term upward momentum during this period. The EMA’s continuous ascent suggests that, from a price action perspective, the index is in a healthy uptrend.
The juxtaposition of the consistently rising SPX 20-day EMA with the weakening short-term breadth (SPXA50R) and merely consolidating long-term breadth (SPXA200R) presents a notable technical divergence. While the index’s price action, as depicted by its 20-day EMA, suggests ongoing strength, the internal components of the market are showing signs of deteriorating participation. This pattern indicates that the upward movement in the SPX might be driven by a decreasing number of leading stocks, rather than a broad-based rally. Such narrow leadership is generally considered less sustainable. It is highly likely that the sustainability of the S&P 500’s current upward trend, as expressed by its 20-day EMA, will face increasing challenges if this breadth divergence persists. A continued decline or stagnation in SPXA50R and SPXA200R makes a significant slowing or even a reversal of the EMA’s ascent increasingly likely in the near future. Conversely, a renewed expansion of participation, particularly in SPXA50R, would be required to provide greater conviction in the current upward momentum of the S&P 500.
SPX Daily
As a Chartered Market Technician with over 15 years of experience, I offer the following technical analysis of the SPX based solely on the provided market data.
The SPX, observed over the 90-day window, demonstrates a strong and persistent bullish trend. Both the 50-day and 200-day Exponential Moving Averages (EMAs) show clear upward trajectories, with the EMA_50 consistently positioned above the EMA_200, a classic “golden cross” configuration affirming the long-term bullish posture. Over the past seven trading days, price action generally supported this momentum, with the index establishing new swing highs. From September 9th to September 15th, the SPX posted notable gains, rallying from a close of 6512.61 to 6615.28. Momentum, as indicated by the 14-day Relative Strength Index (RSI), surged to 70.00 on September 15th, signaling an overbought condition. The most recent two trading days, September 16th and 17th, presented bearish candles. The latest candle closed at 6600.35, below its open, yet featured a long lower wick. This suggests that while sellers emerged, strong buying pressure materialized near the intra-day low of 6551.15, leading to a recovery before the close. The RSI subsequently retreated to 67.24, indicating a cooling of the overbought state.
Immediate technical resistance for the SPX is established at the recent high of 6626.99 (September 16th). Conversely, initial support is likely found at the latest day’s low of 6551.15. A more significant support zone, derived from prior swing lows and the ascending EMA_50, is observed roughly between 6483 (September 9th low) and 6390.99 (current EMA_50). The considerable distance between the current price and both EMAs underscores the index’s recent strength.
The bullish case suggests a continuation of the uptrend is probable if the SPX can decisively clear the 6626.99 resistance level. A strong bullish candle following a positive open, especially if accompanied by a rebound in RSI towards or above 70, would highly suggest renewed buying interest. Should the price hold above the recent low of 6551.15 and then ascend past 6626.99, it is likely to target higher price discovery, with no obvious technical resistance immediately visible beyond this recent peak from the provided data. The long lower wick on the latest candle could be interpreted as dip-buying, providing a foundation for future upside.
The bearish case holds a roughly even chance of a deeper pullback if the 6551.15 support is broken with conviction. A decisive breach of this level would likely lead to a test of the 6483 level, and potentially the EMA_50 at 6390.99. A sustained move below the EMA_50 would indicate a potential shift in the near-term trend from bullish to neutral or even bearish, making further downside to the EMA_200 (6021.10) probable. The neutral case is possible if the index consolidates within the range of 6551.15 and 6626.99, allowing the overbought RSI to normalize without significant price deterioration. Such sideways movement would represent a period of equilibrium between buyers and sellers, with neither side gaining a decisive advantage, thereby preparing for a potential future breakout in either direction.
Based solely on the technical data, sentiment appears to be in a transitional phase, moving from overtly bullish to cautiously optimistic, with increasing signs of profit-taking. The preceding strong rally and overbought RSI likely reflect robust bullish conviction among market participants. However, the emergence of two consecutive bearish candles, even with the presence of dip-buying on September 17th, suggests that some market participants are becoming more prudent, initiating selling pressure to secure recent gains. This dynamic implies a balance between persistent underlying demand and short-term profit realization. A definitive break above current resistance would likely reinforce bullish sentiment, while a sustained failure to hold key support levels could pivot sentiment towards greater caution and potential further downside.
SPX Technical Analysis: Mid-September 2025 Outlook
Over the past 90 days, the S&P 500 (SPX) has exhibited a dominant bullish trend, characterized by a clear pattern of higher highs and higher lows. Significant upward movements were observed from early May, peaking in mid-May, followed by another sustained rally from early June through early July, and most recently, a robust surge from late August through mid-September. Periods of pullback or consolidation, such as those experienced in late May, mid-June, and early August, were consistently met with renewed buying interest, ultimately leading to the establishment of new price highs. The latest data point shows the SPX closing near its all-time high within this period, indicating persistent underlying strength.
Current momentum indicators largely affirm this prevailing bullish outlook. The 14-day Relative Strength Index (RSI) is presently at 67.24, signaling strong upward momentum for the SPX. Importantly, this value remains below the conventional overbought threshold of 70+, where prior rallies within this 90-day window have frequently encountered resistance or initiated short-term consolidations. Concurrently, the 13-21-day Percentage Price Oscillator (PPO), currently at 0.536, has demonstrated a distinct upward trajectory since early September from its August lows, effectively confirming the recent acceleration in price. Given these concurrent bullish signals from both price action and momentum, continued upward momentum for the SPX is likely in the immediate term.
Despite the current bullish sentiment, market participants should consider several technical factors that could temper the rally or lead to a temporary pause. The RSI, while not yet at extreme levels, is approaching the upper bounds where past rallies have often experienced short-term consolidation or minor pullbacks; for instance, the RSI reached approximately 75 in late June and 76 in late July before price cooled. Should the RSI push further into overbought territory (above 70) in the coming days, a temporary deceleration or modest price retreat is a roughly even chance. Furthermore, a careful examination of the PPO reveals that its current peak of 0.536 is notably lower than previous highs observed in May (1.37) and July (0.94). This pattern of lower PPO highs, even amidst an upward price trend, could imply that the current bullish momentum, while present, may possess somewhat weaker underlying force compared to earlier, more aggressive rally phases. Consequently, it is a roughly even chance that the rate of ascent in this current leg may moderate or prove less sustained than previous strong surges without a corresponding acceleration in the PPO.
In conclusion, the SPX is likely to attempt further upside in the near term, buoyed by recent strong price action and supportive momentum indicators. However, market participants should remain vigilant of the RSI’s proximity to potentially overbought conditions, which presents a roughly even chance of a short-term consolidation or pullback. The observed relatively lower peak in the PPO compared to previous rallies suggests it is a roughly even chance that the current upward trajectory may be less aggressive or durable than prior extensions. The dominant trend remains bullish, but these subtle indicator divergences warrant a cautious perspective on the immediate sustainability and magnitude of the rally without additional technical confirmation.
<style> .container {display: flex;justify-content: center;align-items: center;} .item {margin: auto;} </style>
<div style="widht:auto">
</div>